Fiscal Year Reporting: Services or Involvement Duration
This article will cover how to use Calculated Fields to create a report that shows clients with a case involvement or enrolled in a service during a specified time period.
How to create a report that answers the question: How many clients received a service during each quarter (or month)?
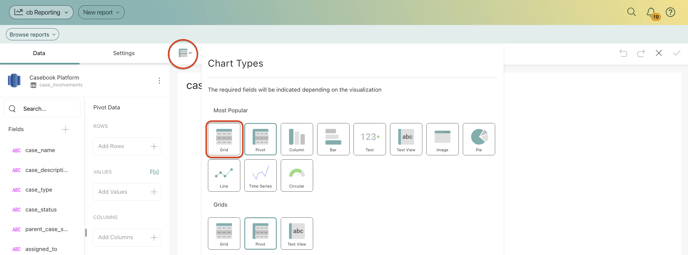
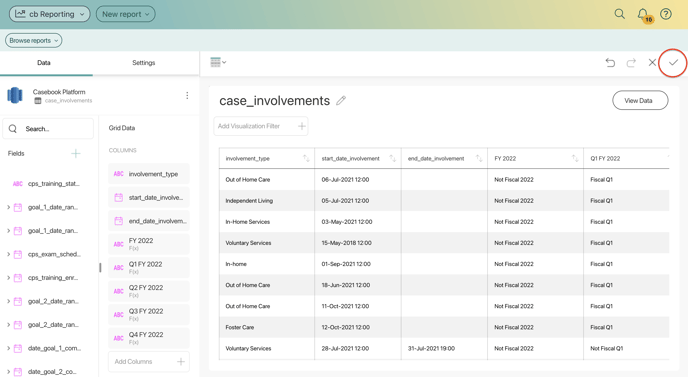
Create a New Visualization
Select the Case_Involvements Dataset
Change the Chart Type to Grid
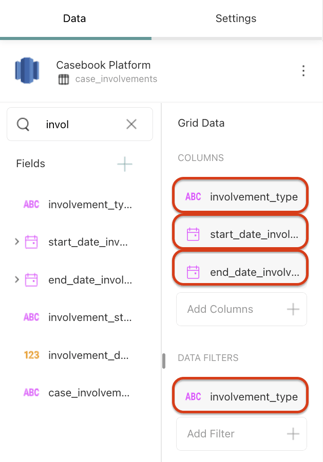
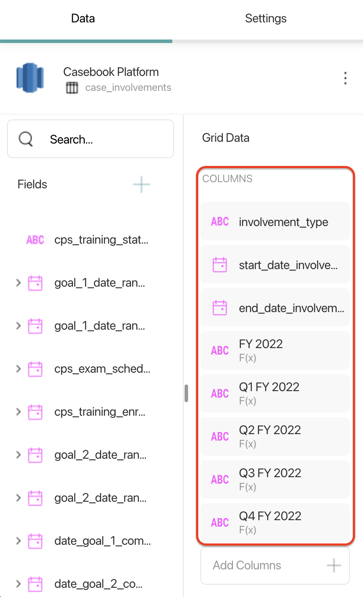
Drag and drop the following fields into the Grid Data section under Columns
Involvement type
Involvement Start Date
Involvement End Date
Add a Filter for Involvement_Type and select the involvements that you wish to track in this report
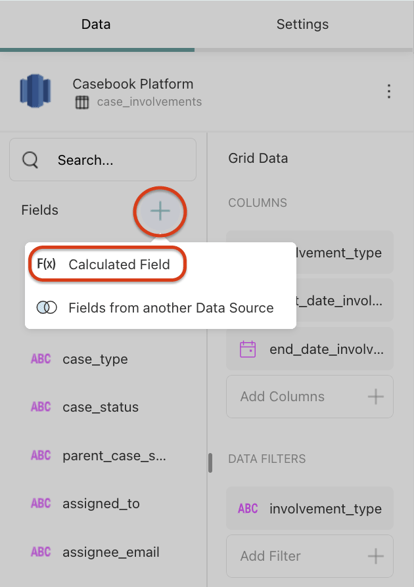
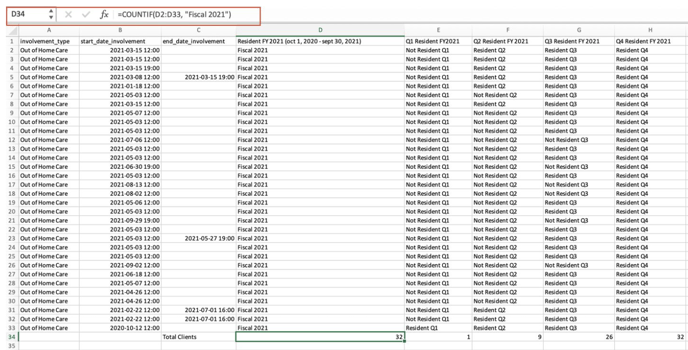
Add a new Calculated Field by selecting the + Icon in the Fields List, then selecting Calculated Field
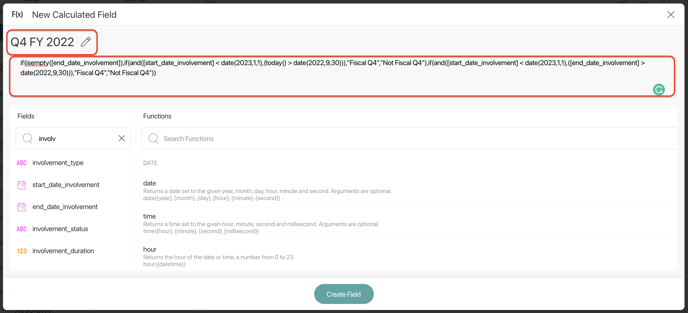
Name the Field, then add the following formulas: Please note that you will have to repeat this process for each formula