Data entry is at the heart of what you use Casebook for, but it can be challenging to ensure the information is up to date and entered in a way that provides the right setup for reporting. To provide greater insight into your data entry practices, we built a Pre-Built Report to help organizations understand their data gaps. For example, if you have a service enrollment open with a planned end date in the past, why? It will allow an easy at-a-glance look into your data to ensure you're staying up-to-date and compliant.
Data Quality Dashboard Sections:
Service Enrollments:
The information in this section is intended to help you evaluate if your Service Enrollment Data has any errors. We have divided it into three types of concerning enrollments:
- The service enrollment is open, but the planned end date was in the past.
- The service enrollment has been open for 90 days, and there's no planned end date.
- The service enrollment is open, but there is no start date or planned end date.
Visualization 1: Number of Service Enrollments with a Data Issue
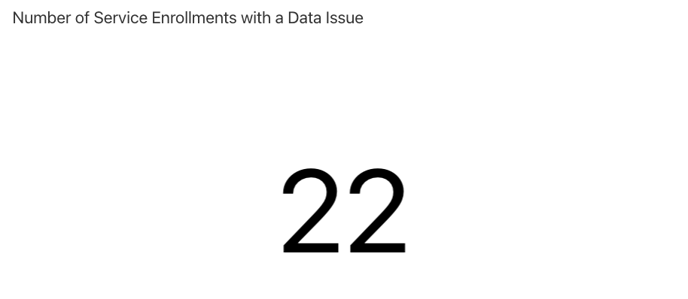
This report will show you how many Service Enrollments your organization has that may fall into a potential data issue category (see above categories).
Visualization 2: Service Enrollments by Data Issue Type
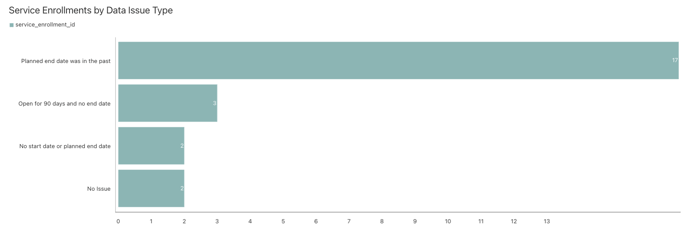
This report will show you how many Service Enrollments your organization has in each data issue category.
Visualization 3: Problem Service Enrollments
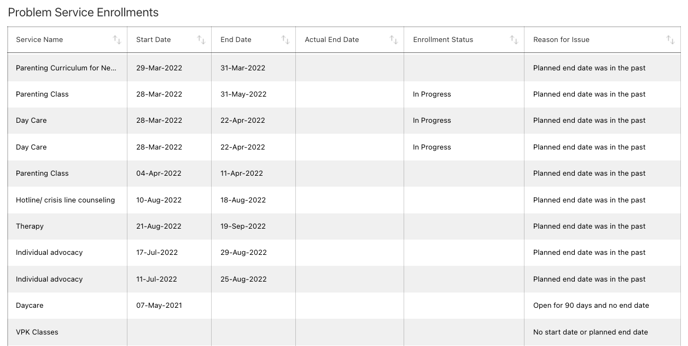
This report will show you the Service Enrollments that make up the two previous reports so that you can take a closer look.
Intake Reports:
The information in this section is intended to help you evaluate if your Intake Report Data has any errors. We expect that Intake Reports would require attention at a faster pace, so we have broken them down into aging intake reports with no decisions by days and weeks.
Visualization 1: Intake Reports with no decision open more than 7 days
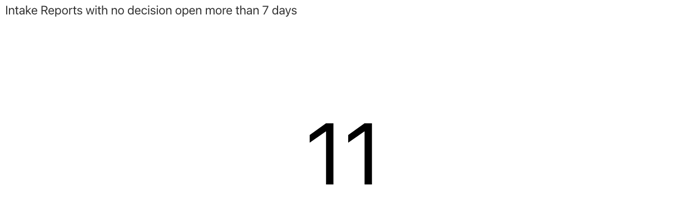
This report will show you how many Intake Reports your organization has that have been open for more than 7 days. If your organization uses a different amount of time as your benchmark, you can edit this report by adjusting the Data Filter, see below. 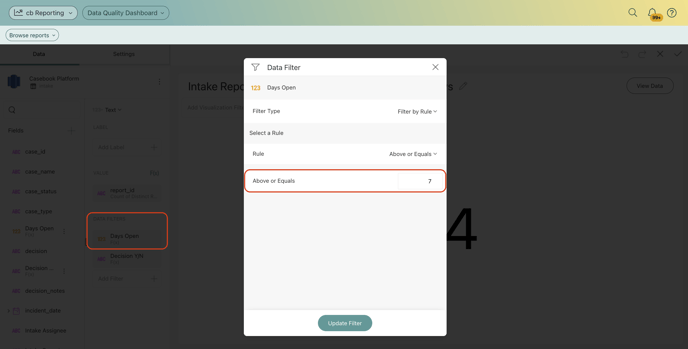
Visualization 2: Intake Reports with no decision open by days open
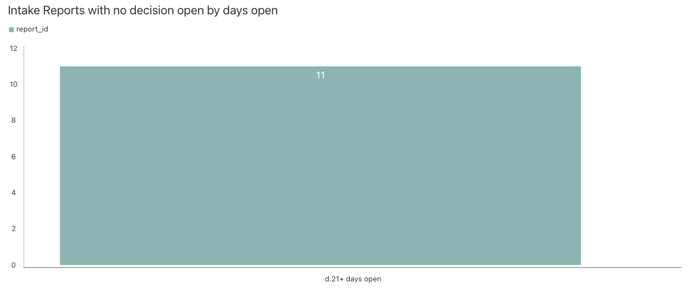
This report will show you the number of Intake Reports open by days open so that you can identify trends in your data.
Visualization 3: Intake Reports with no decision
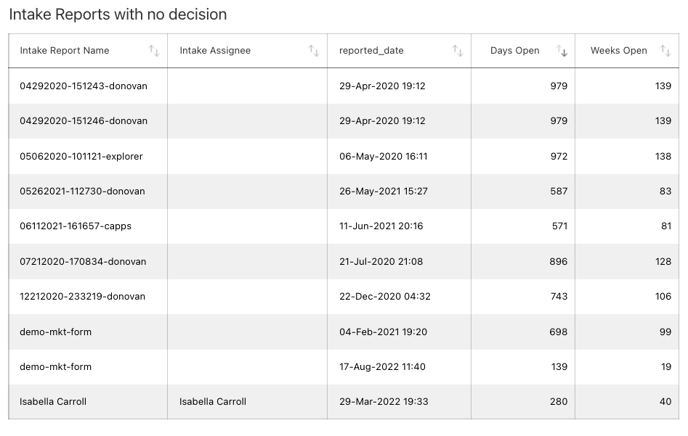
This report will show you the specific Intake Reports that make up the two previous reports so that you can take a closer look.
Duplicates:
The information in this section is intended to help you evaluate if you potentially have duplicates in your People, Cases, or Intakes. This is not exhaustive but is intended to be a beginning point of investigation. If there is more than one record in the table, it's possible it's a duplicate, and we recommend looking into it.
Visualization 1: Potential Duplicate People
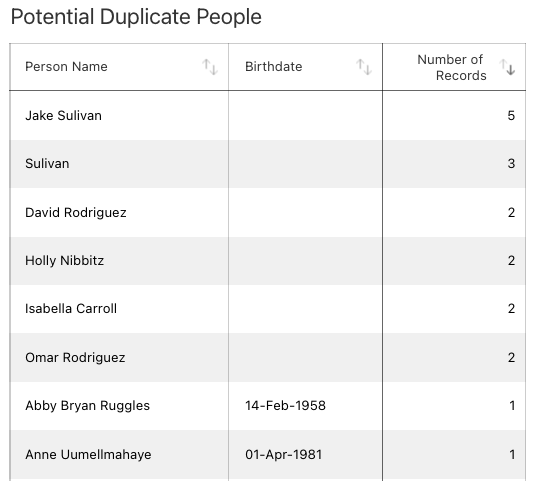
This report shows you potential duplicate Person Profiles. Simply sort this report by Number of Records = Descending. Any record that has a number greater than 1 in this column, could be a potential duplicate and should be looked into.
Visualization 2: Potential Duplicate Intake Reports
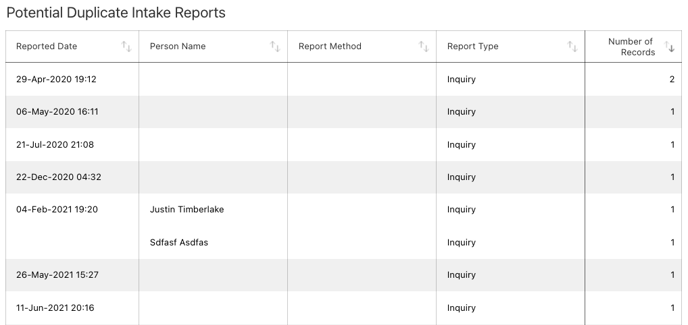
This report shows you potential duplicate Intake Reports. Simply sort this report by Number of Records = Descending. Any record that has a number greater than 1 in this column, could be a potential duplicate and should be looked into.