Reusing Visualizations
Speed up the creation of custom dashboards by reusing visualizations.
How to Copy and Paste a Visualization:
You can copy & paste any visualization within a dashboard or even across dashboards. Note that you can create new dashboards by combining visualizations from other dashboards.
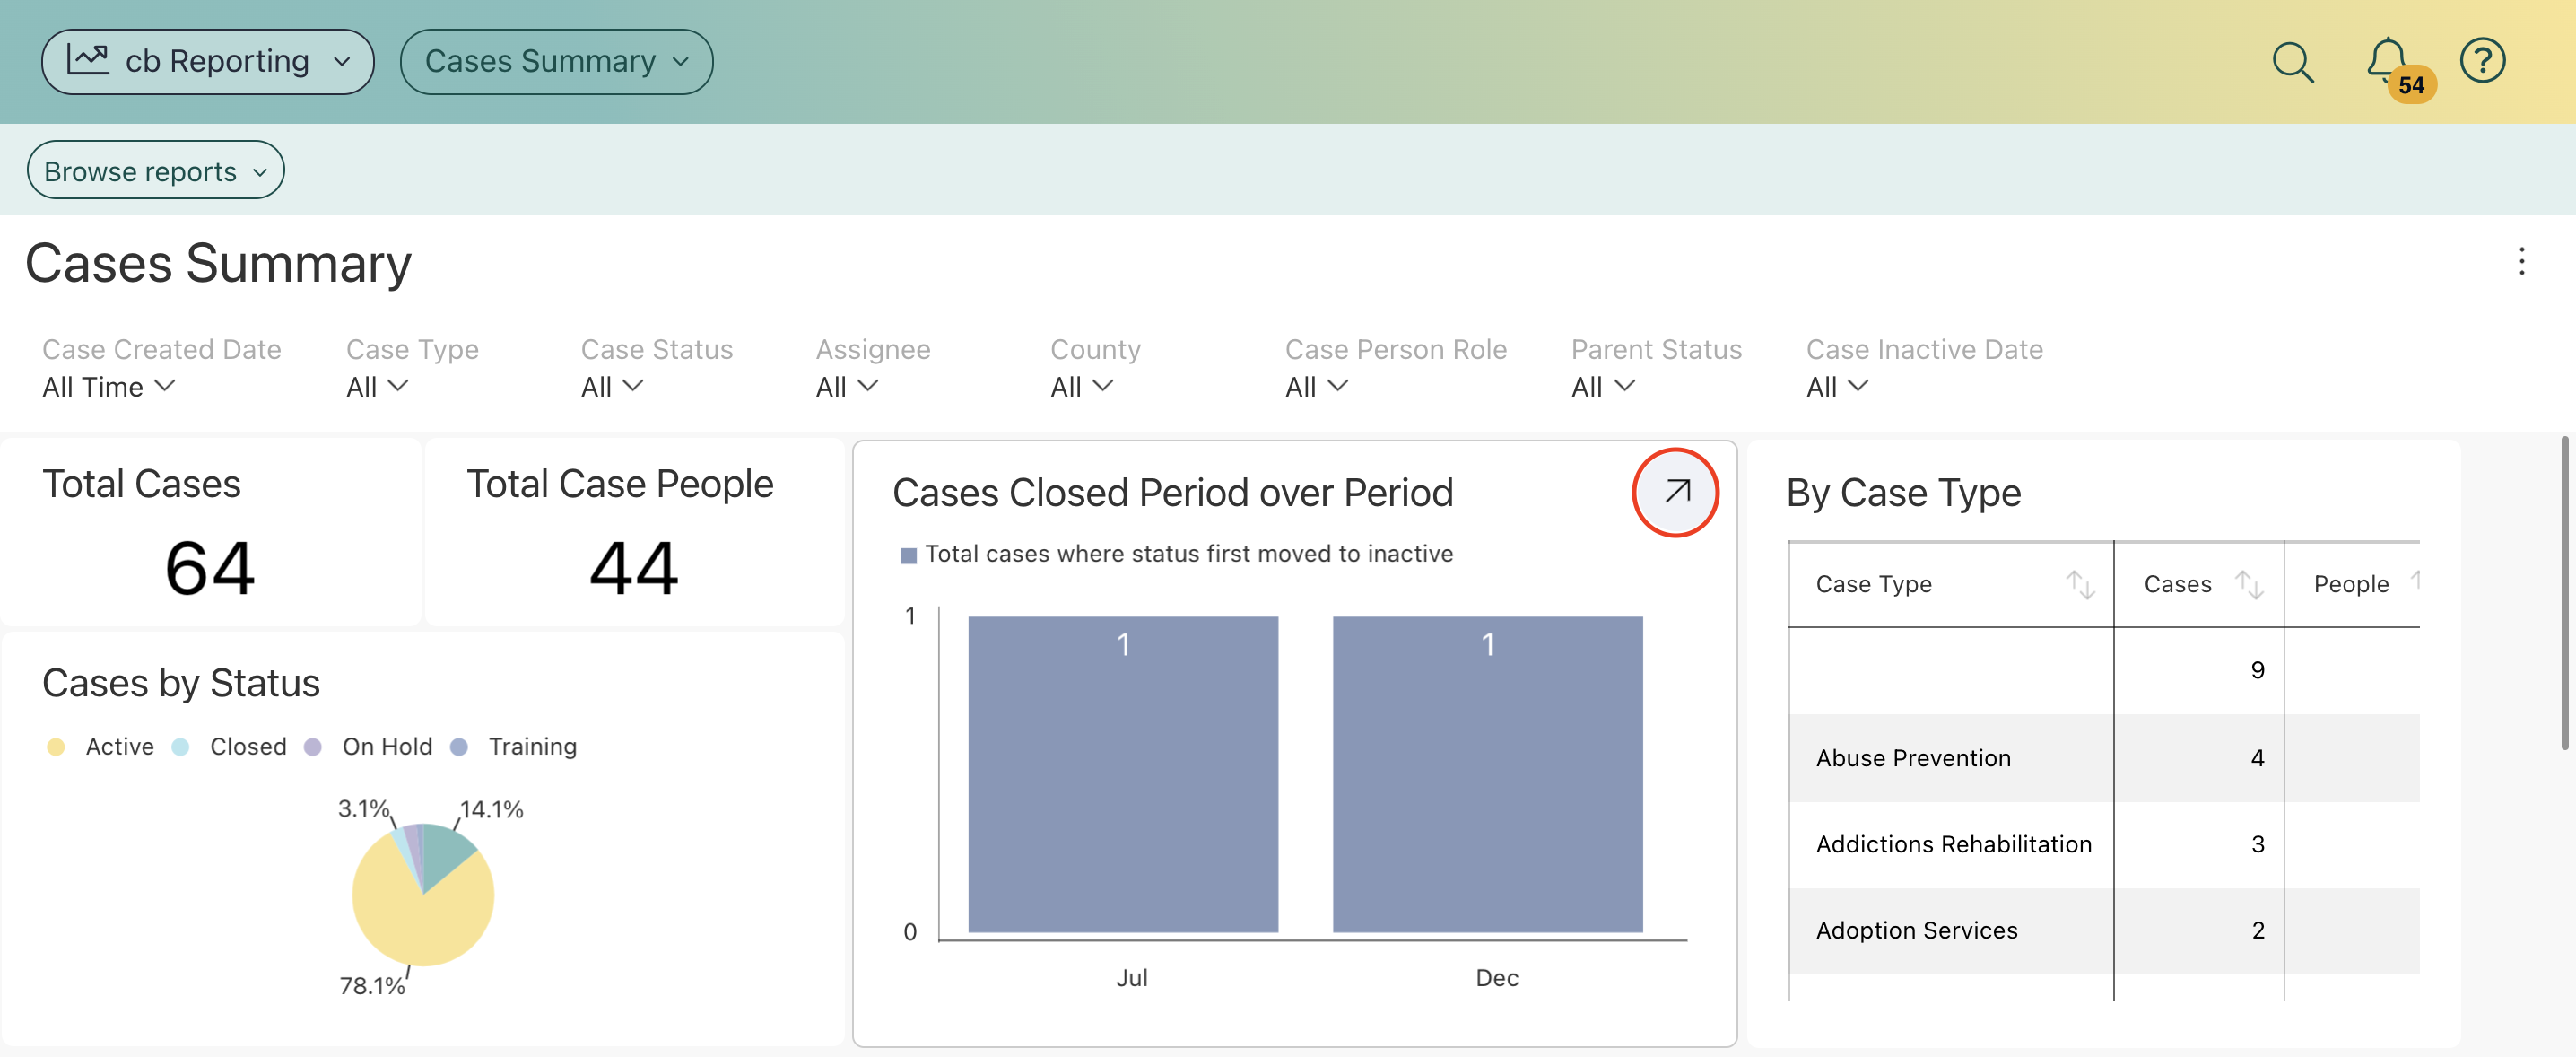
- From a Dashboard, select the arrow icon in the upper right-hand corner to expand a widget.
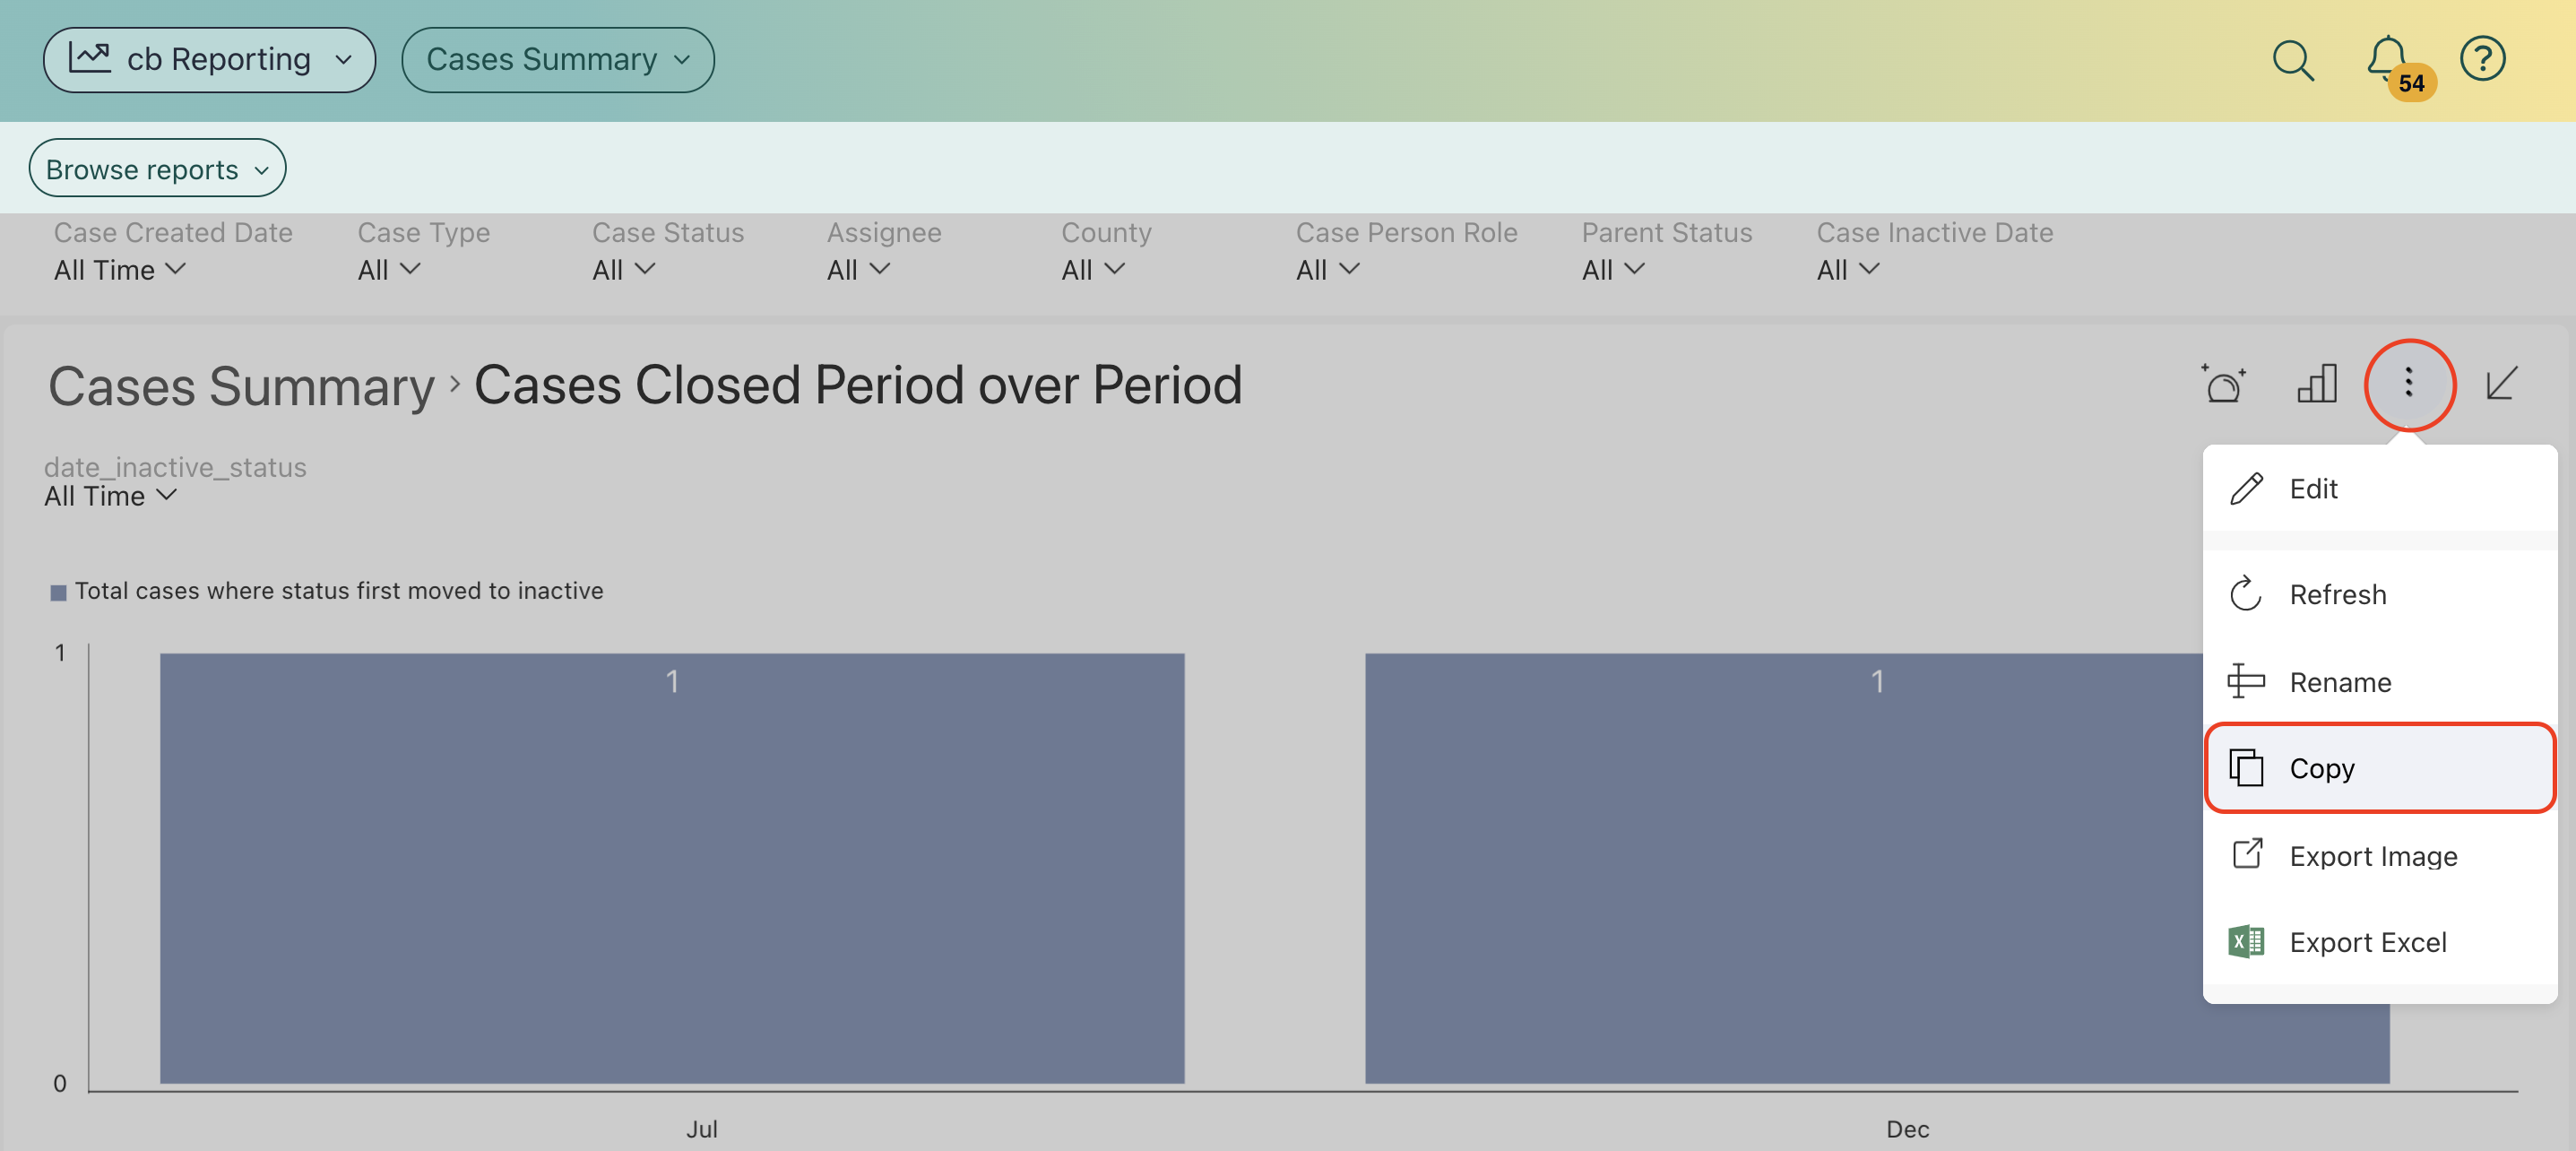
- Select the three ellipsis icon, then select copy.
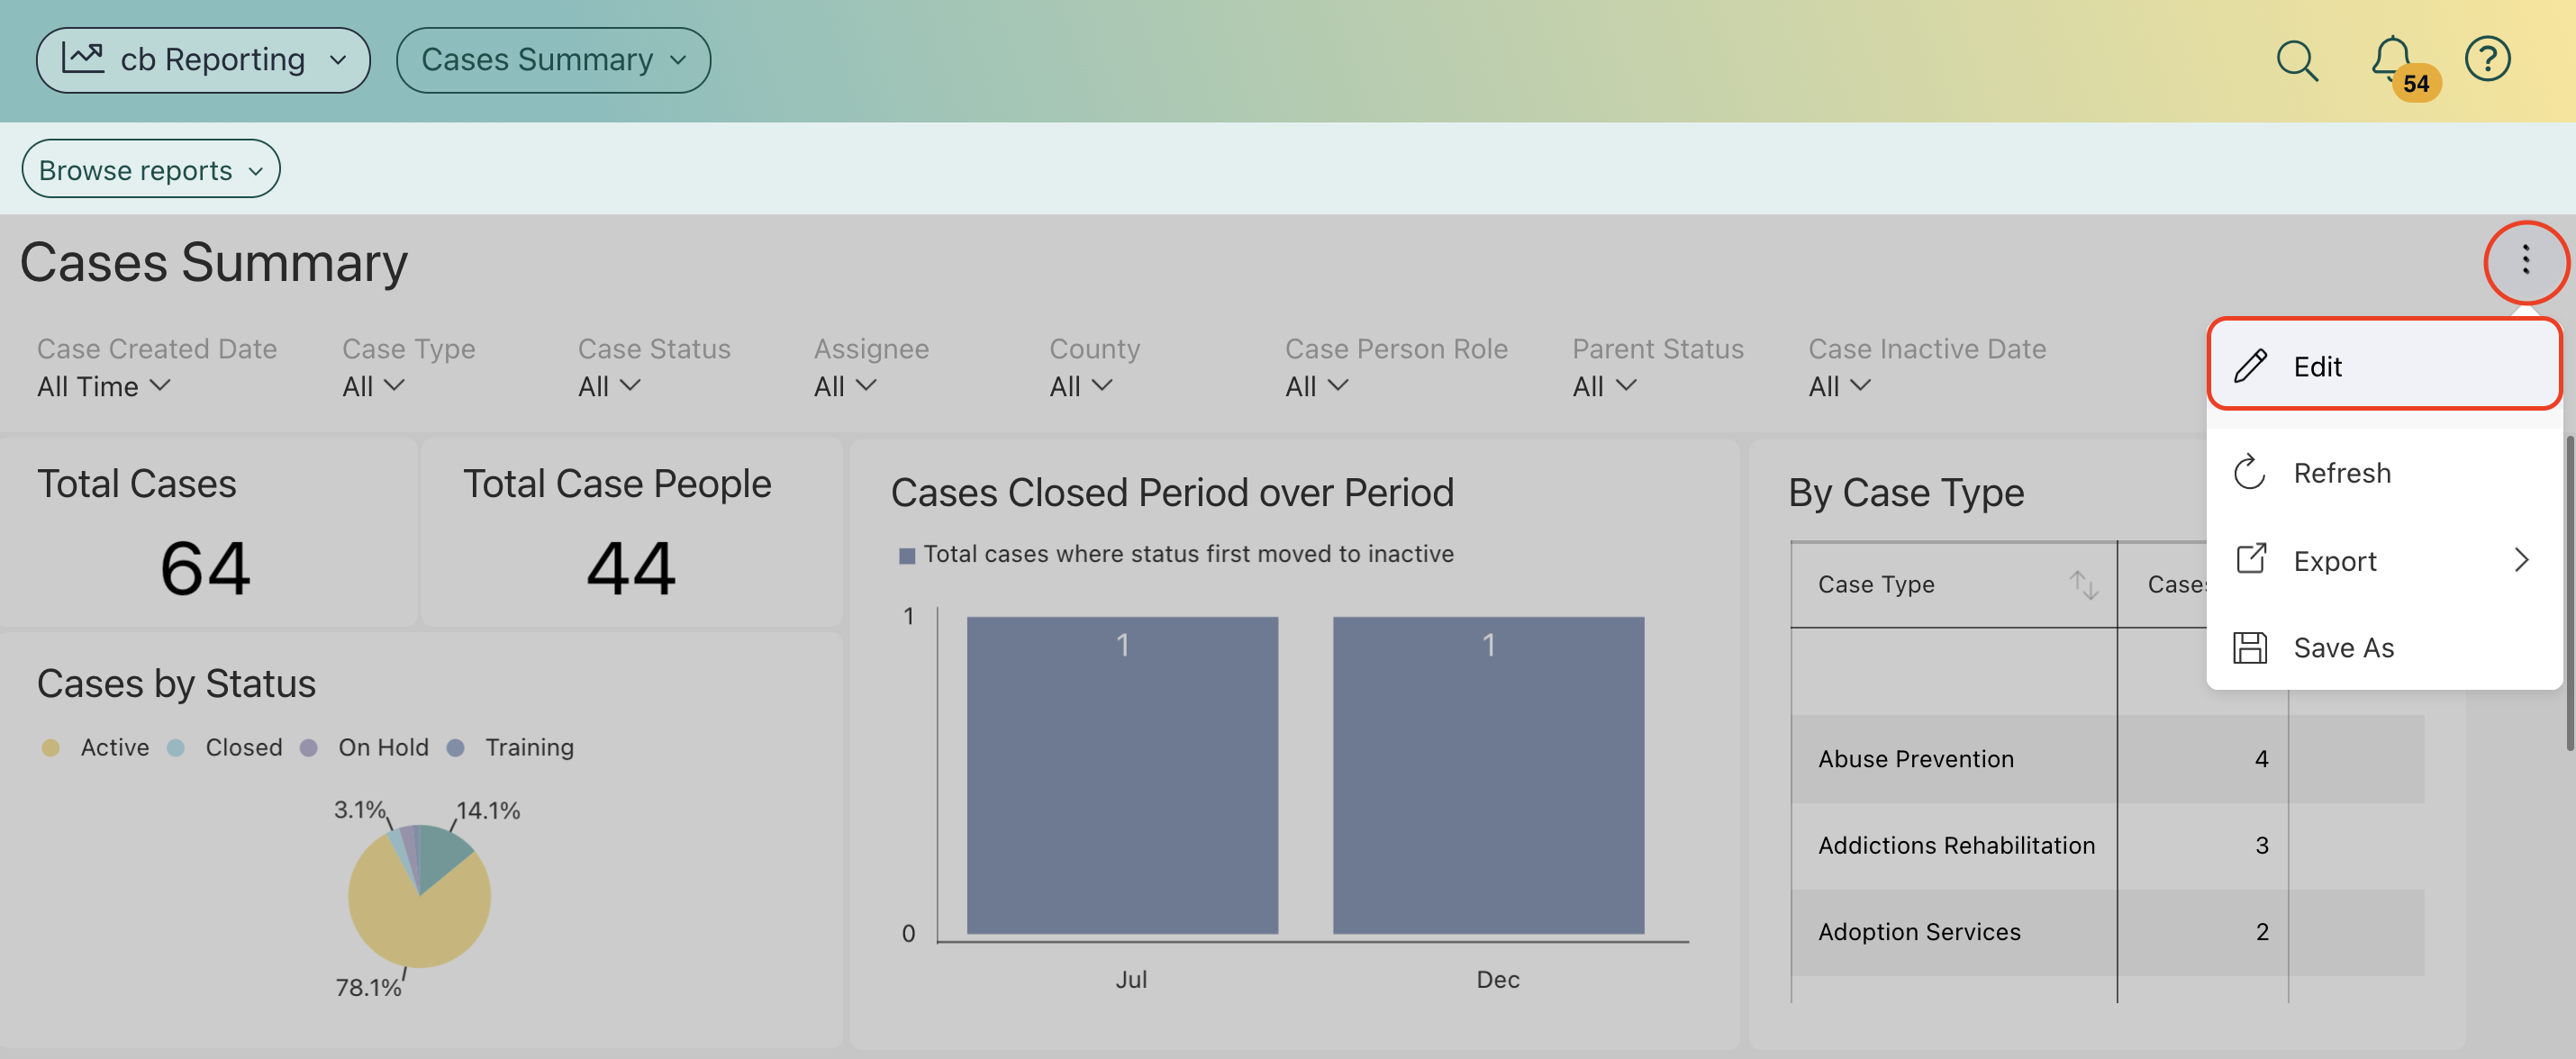
- Navigate to the Dashboard where you wish to paste the widget you copied. Select the three ellipsis icon, then select edit.
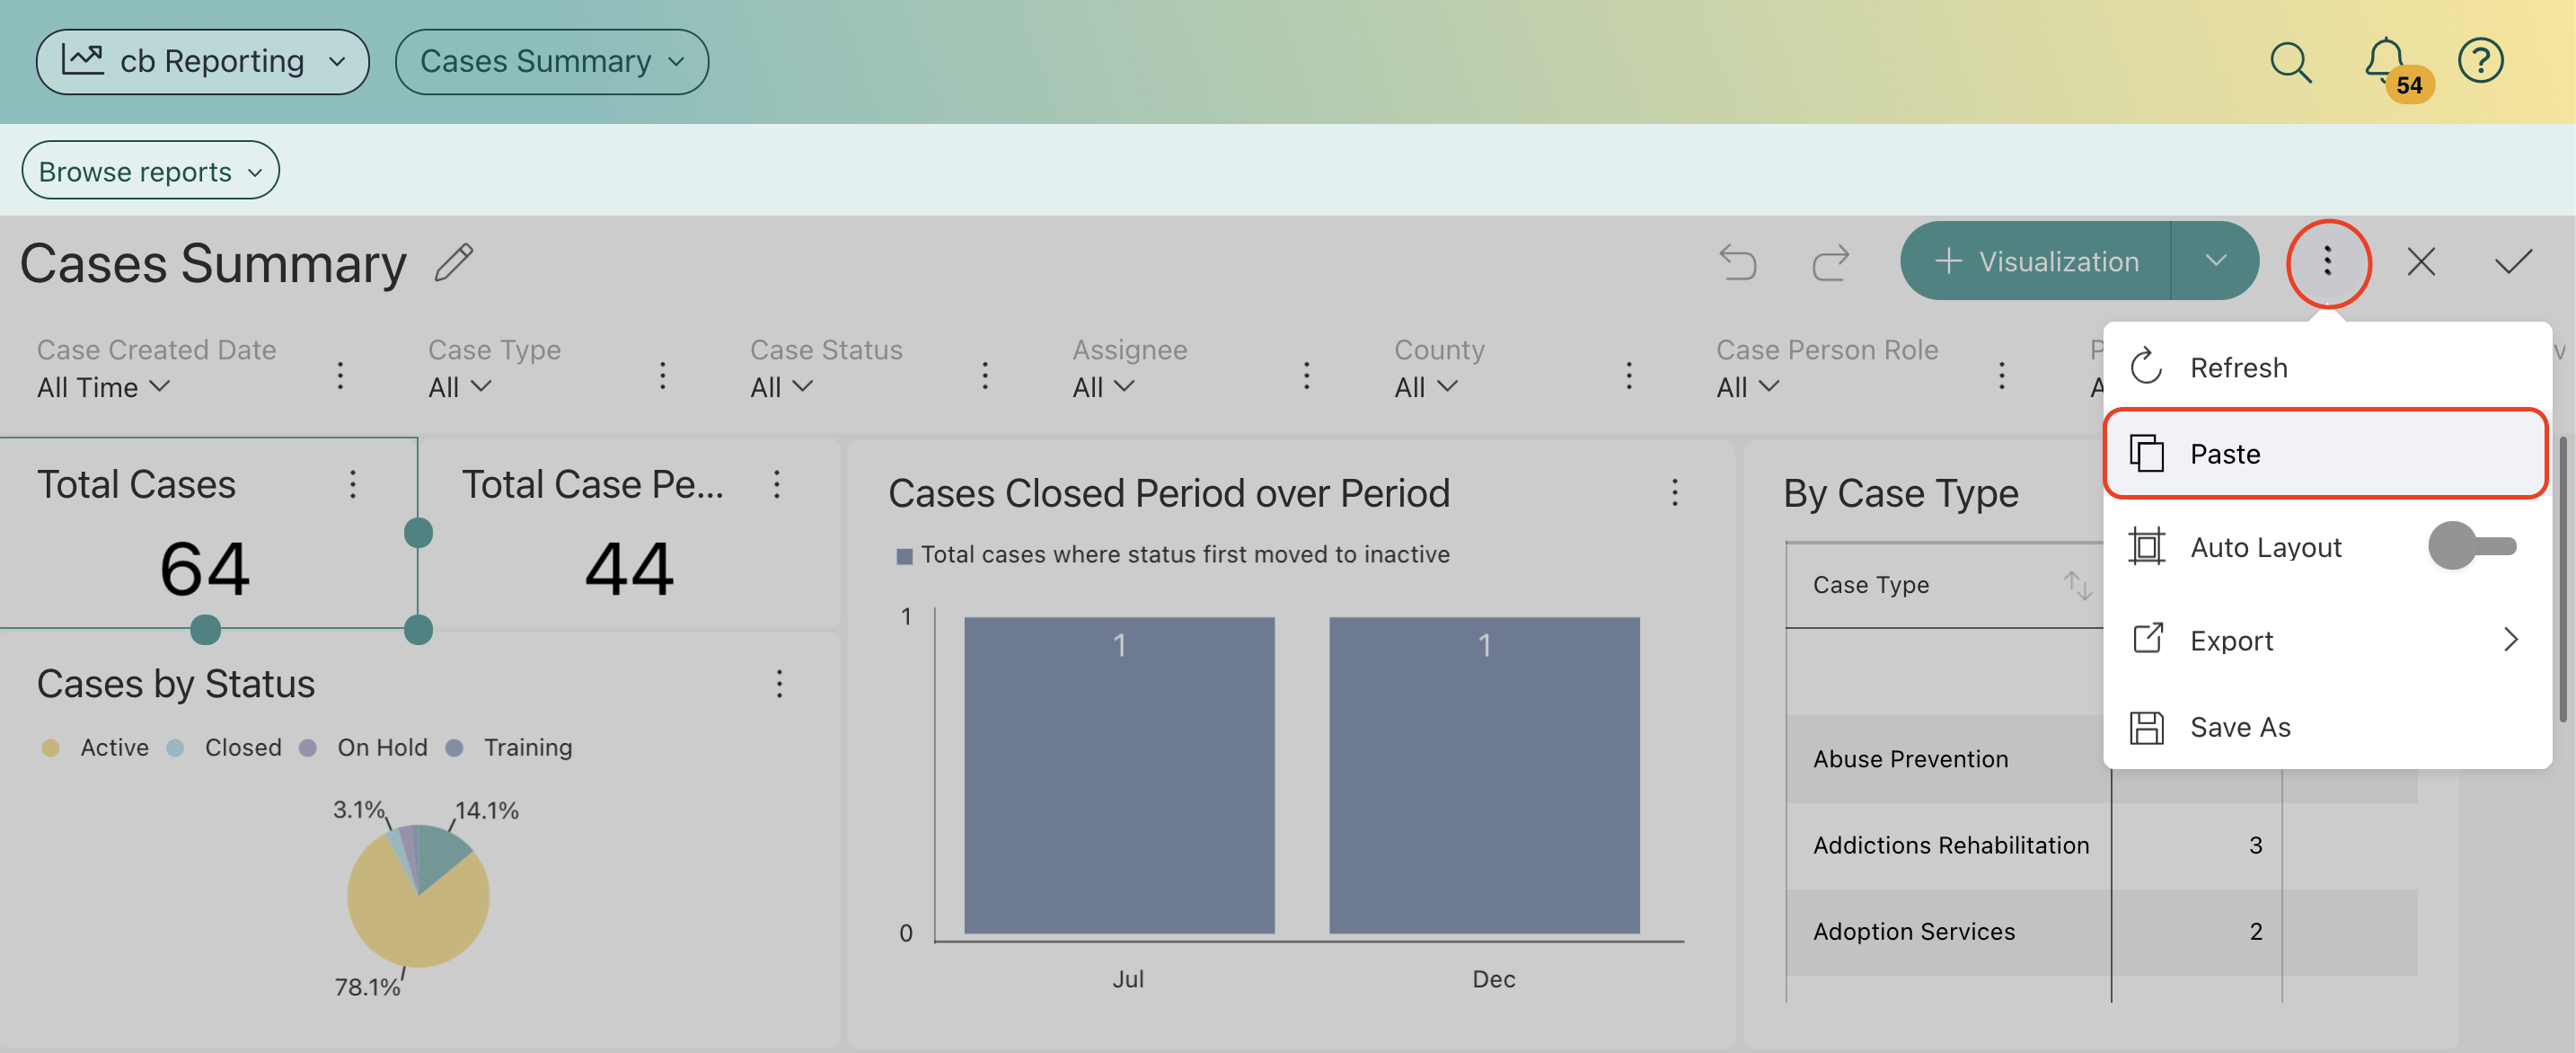
- In the Dashboard Edit Mode, select the three ellipsis icon, then select paste. This widget will paste to the bottom of the Dashboard.
Things to Consider:
Your new visualization will have the same title as the original visualization.
You can select Rename from the overflow menu of a visualization in Dashboard Edit mode. 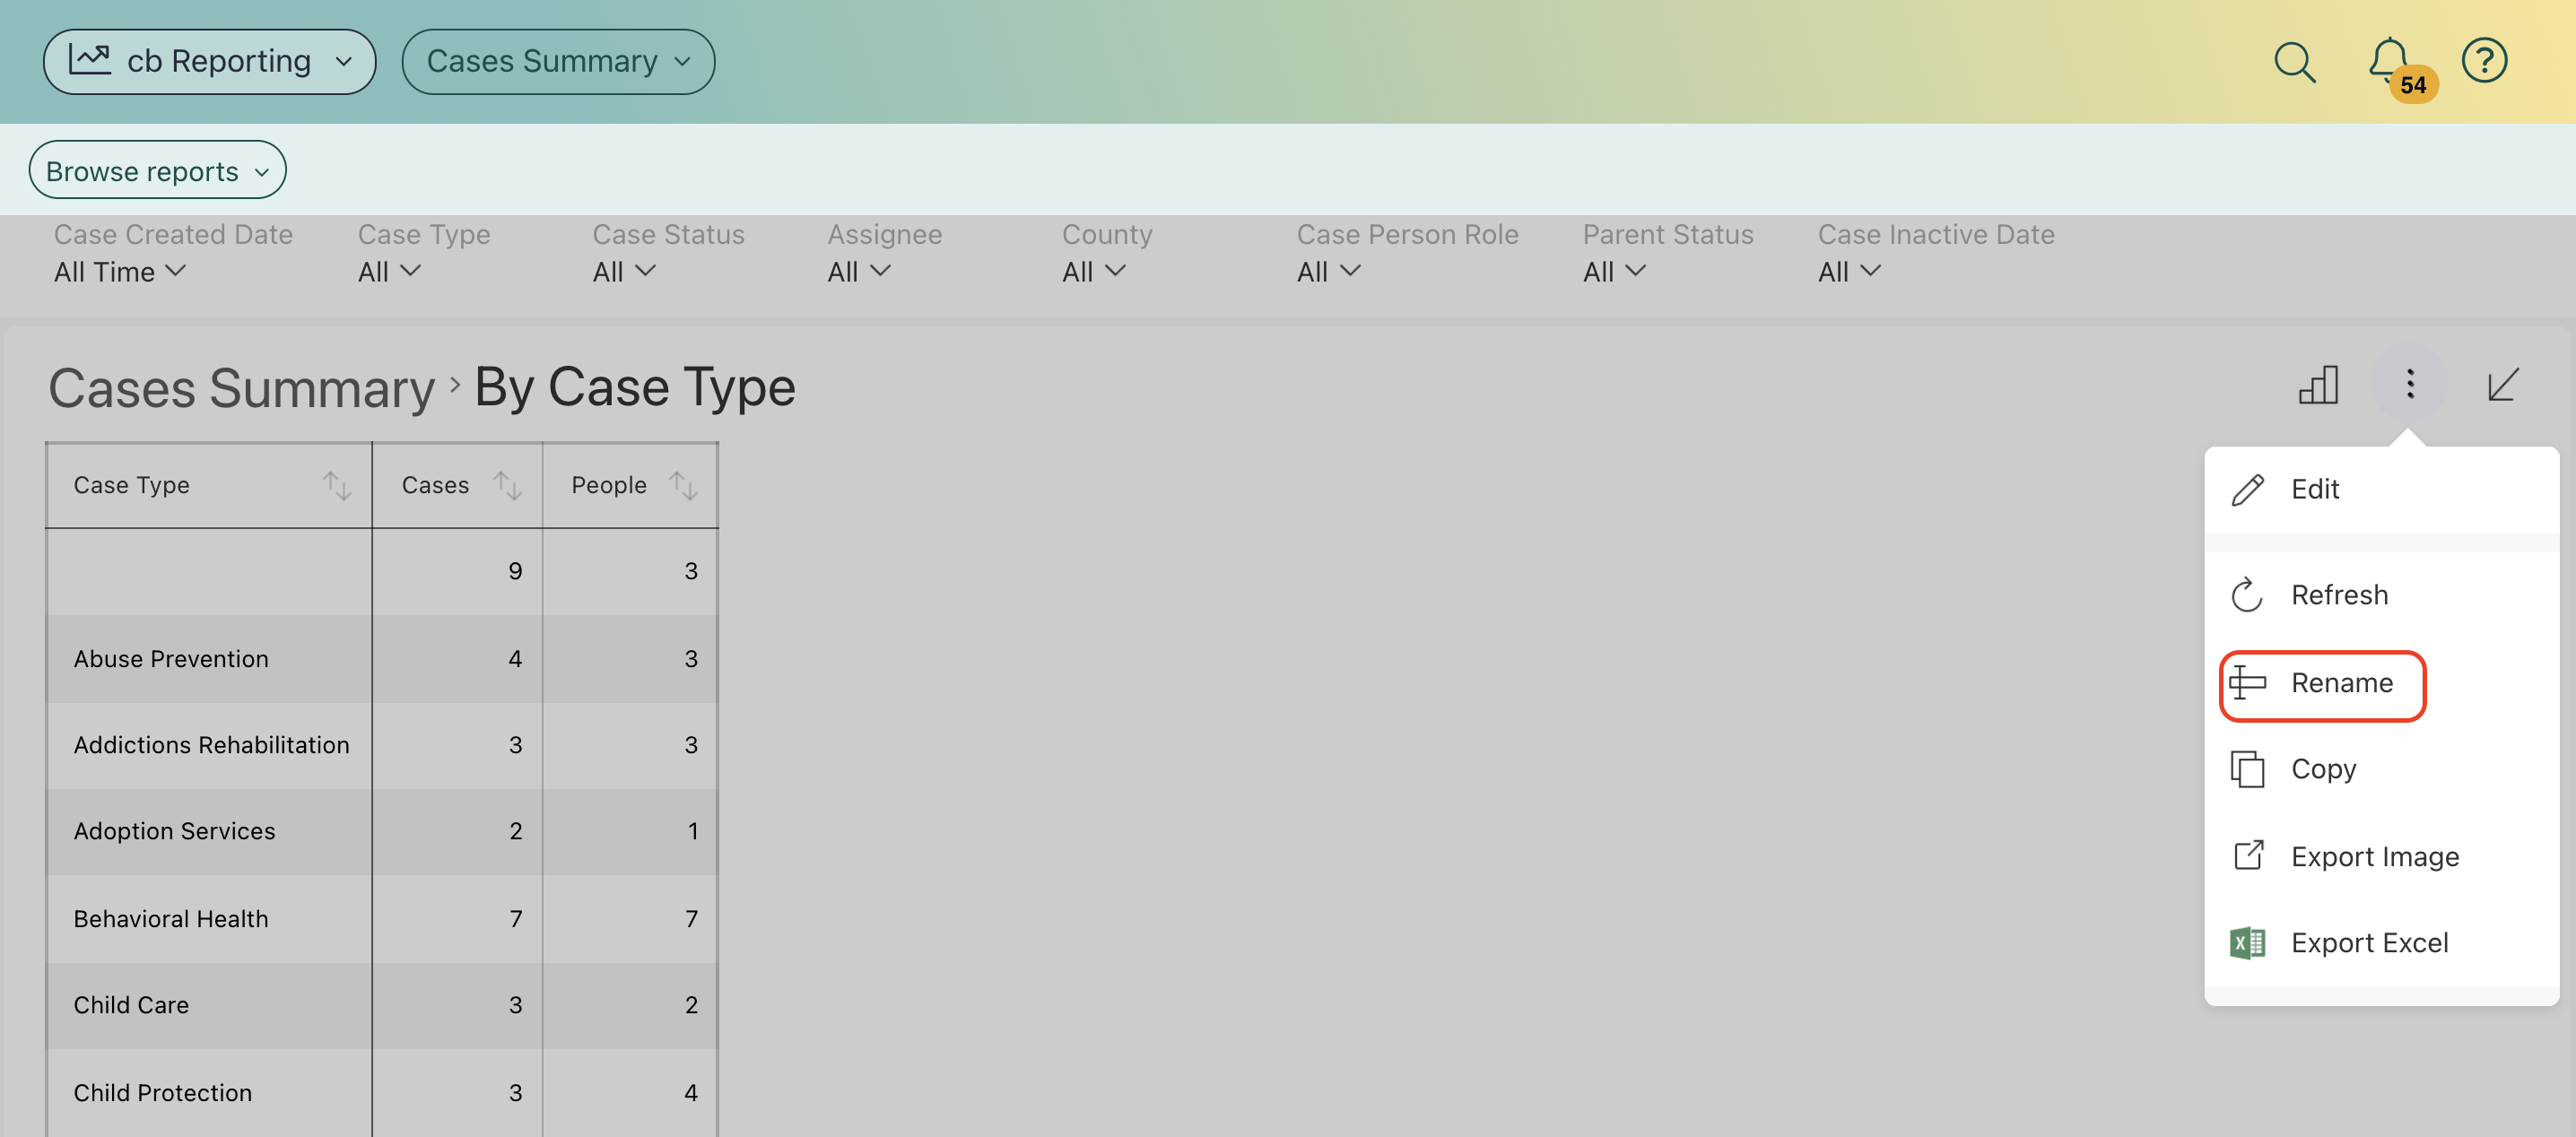
.png?width=1286&height=255&name=logo-raspberry%20(1).png)