Data Filters
You can apply filters or rules to the fields in your dataset.
How to Add a Data Filter to a Dashboard:
- From the Report Builder, navigate to the Data Filter section.
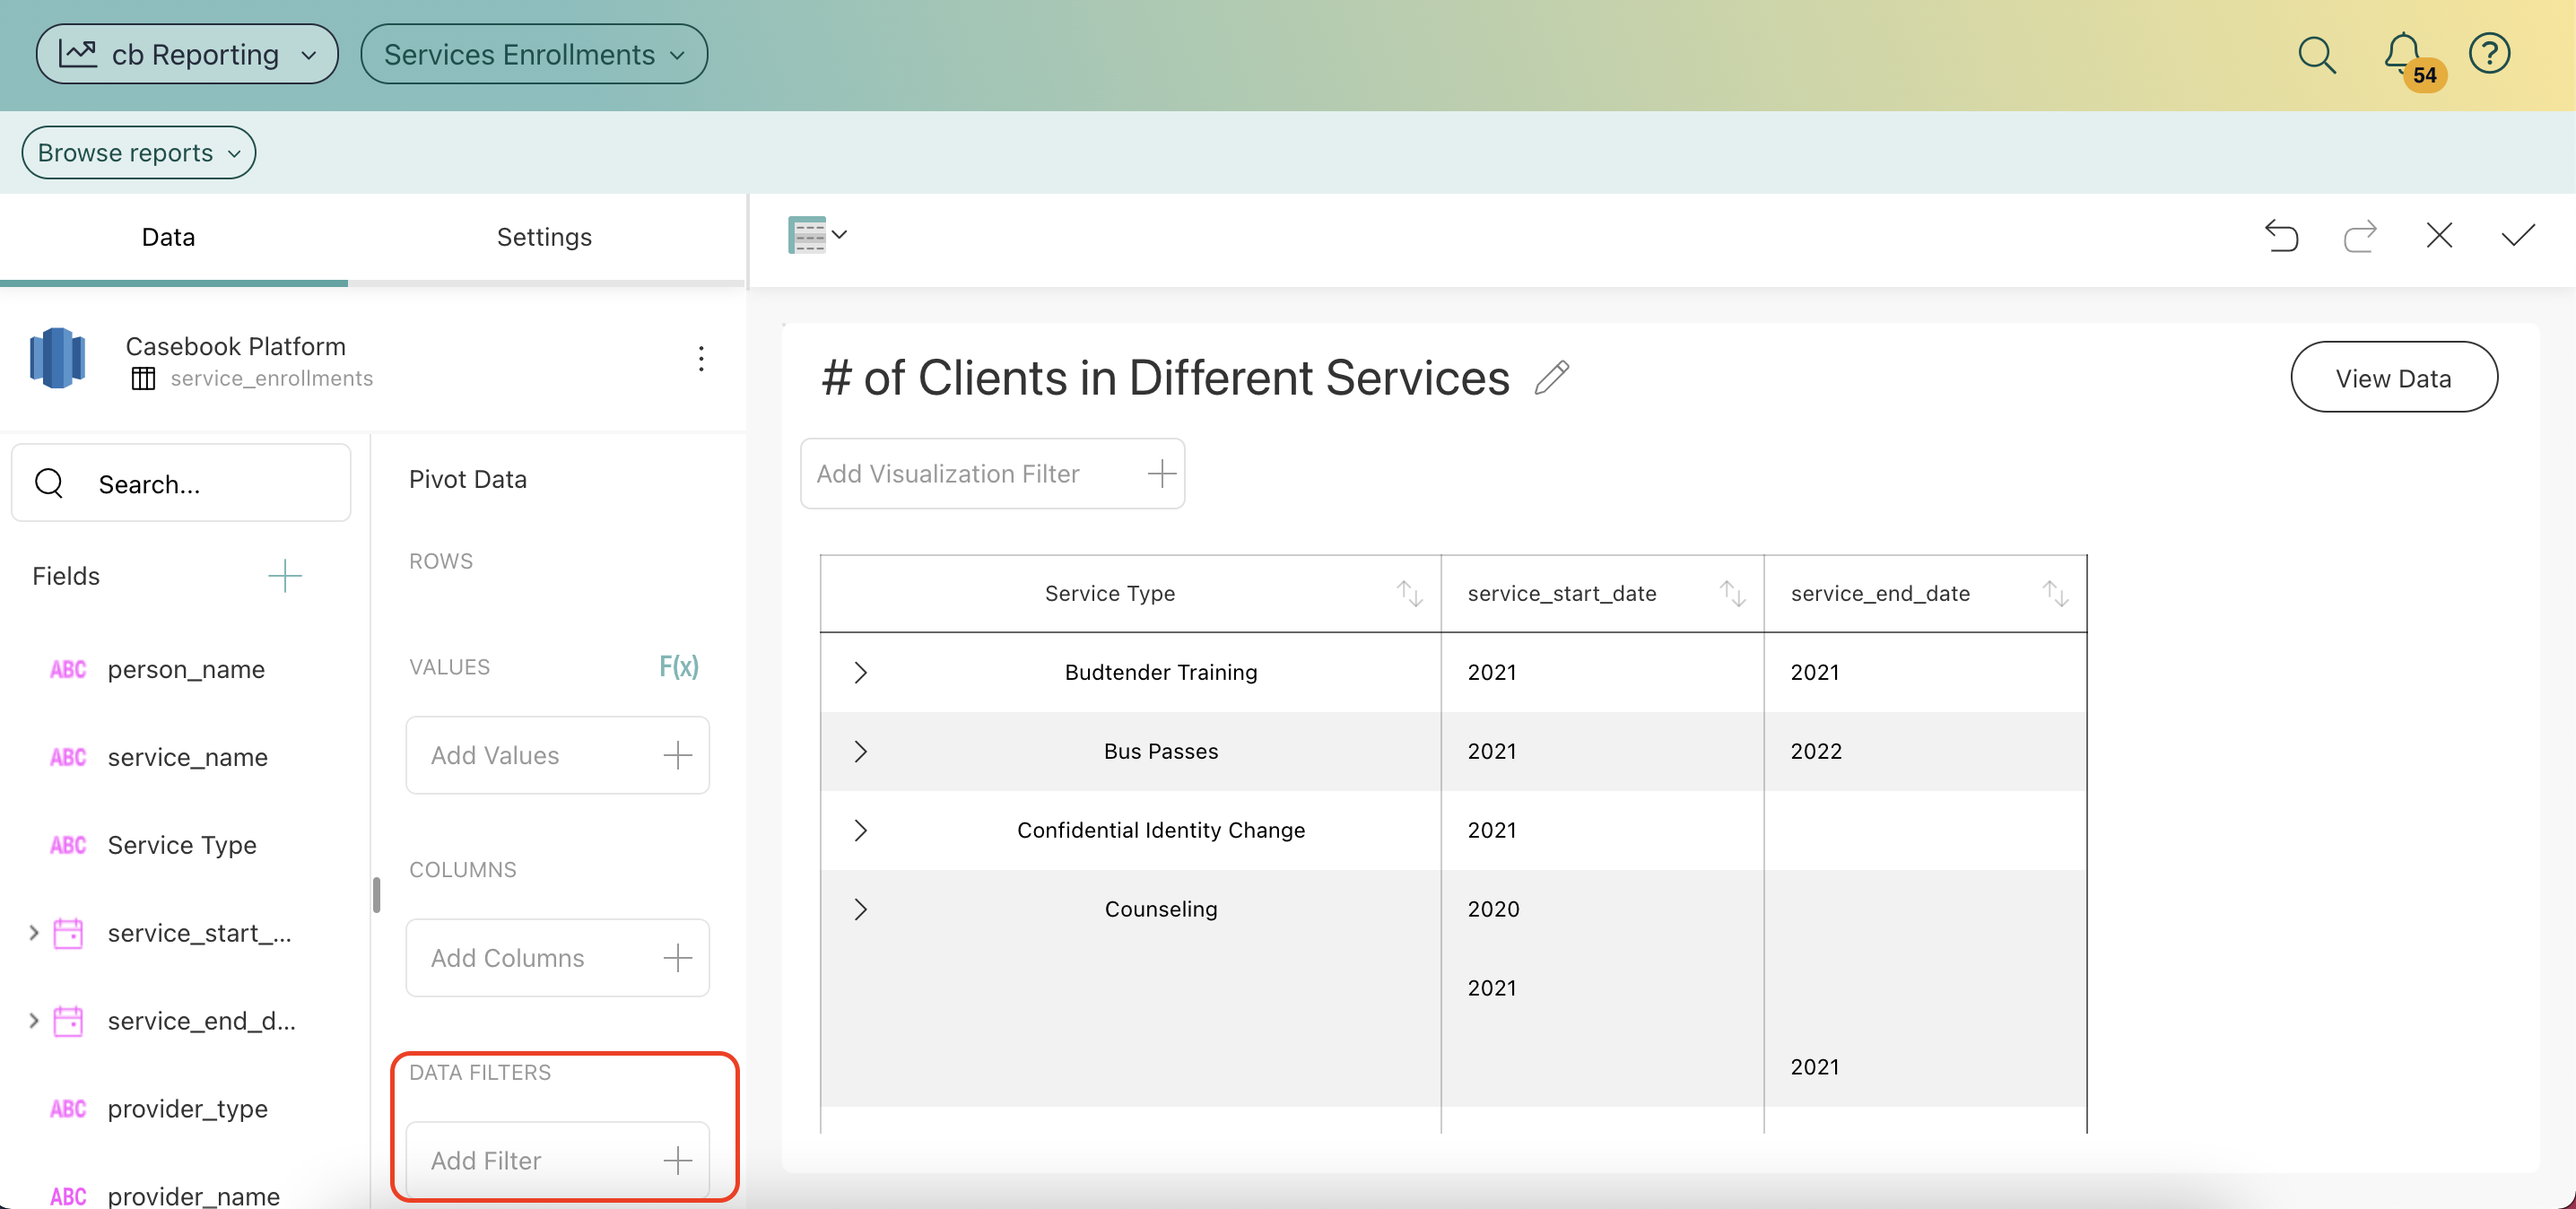
- Drag and drop the field that you wish to use to filter the report into this section. This will prompt a modal to pop up.
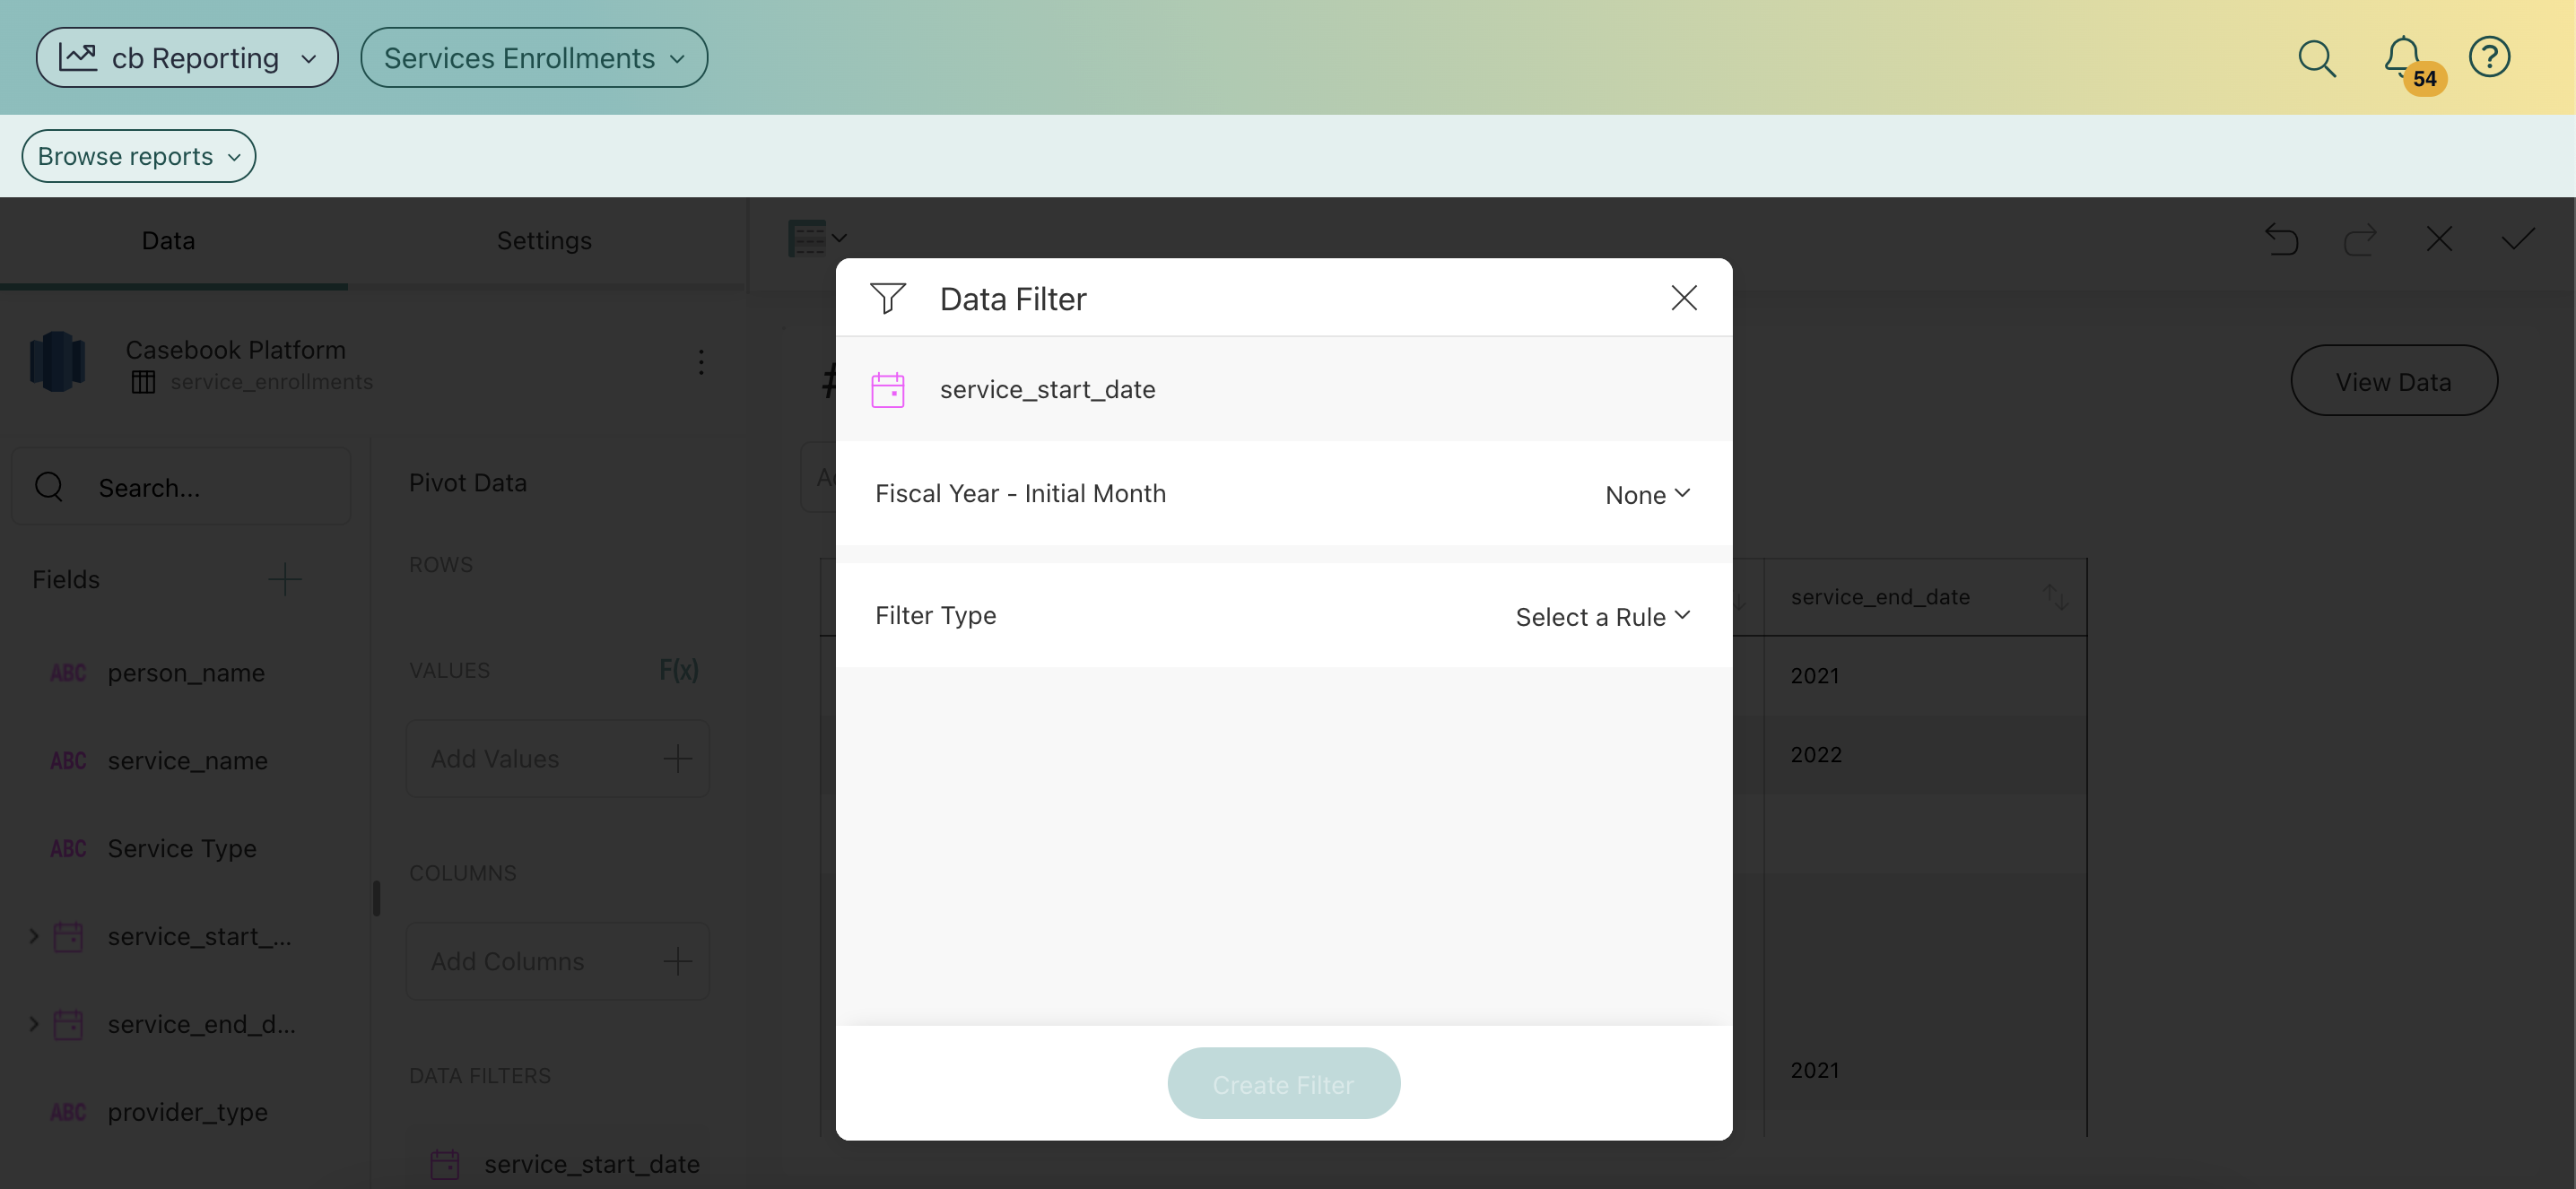
- Select the rule to filter by, Filter Types are shown below:
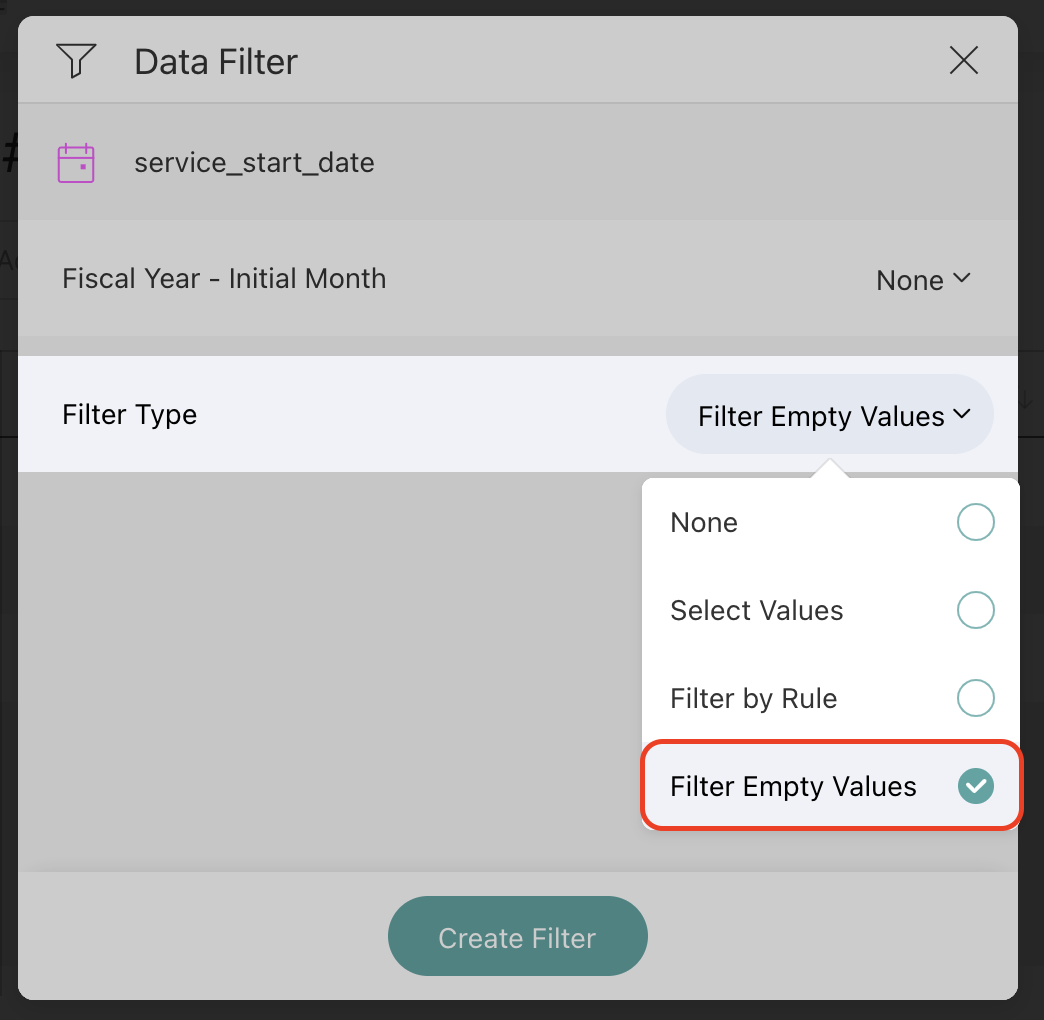
Filter Empty Values
cb Reporting provides the ability to filter rows in the dataset that have null or empty values on a specific column.
Select Values
This displays the list of possible values for a column and allows you to select only the items you want to remain in the dataset. Rows with values excluded by the filter aren't displayed in the visualization.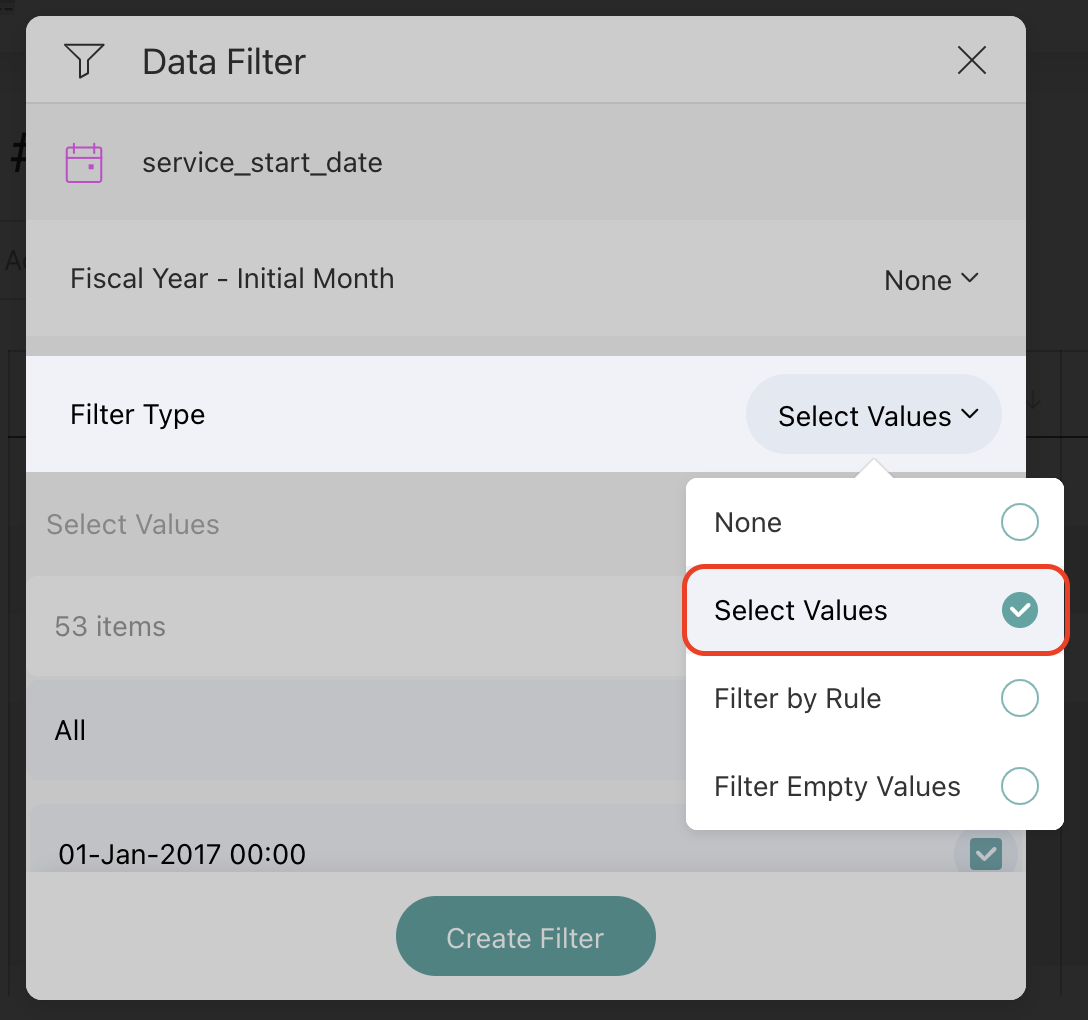
Filter by Rule
The Filter by Rule option enables the definition of more complex rules. The available rule options change depending on the field type.
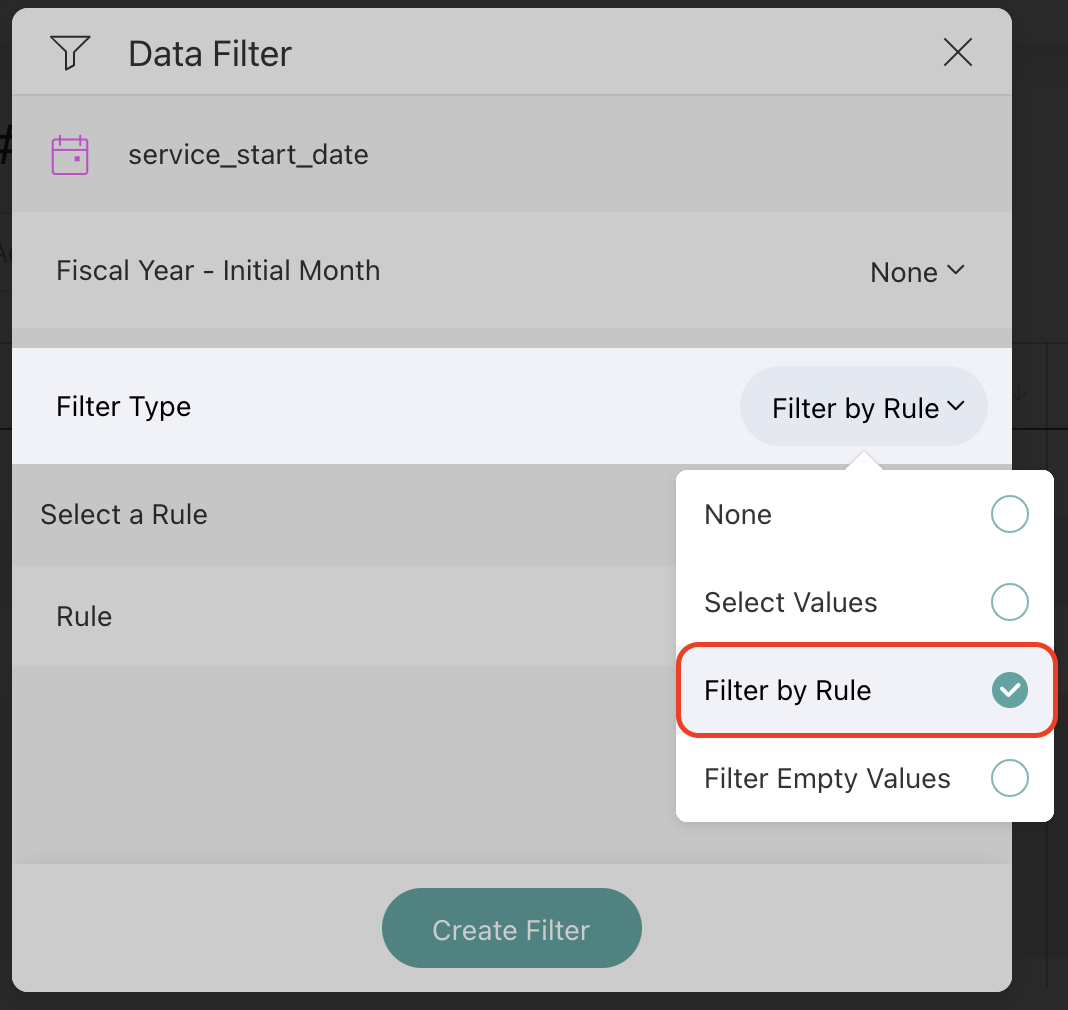
Date fields include rules designed to support time-based scenarios, changing the data range, and filtering the information displayed in the visualization.
-
Custom Date Range
-
Last Week, Month, or Year
-
Month to Date
-
Next Month, Quarter, or Year
-
Previous Month, Quarter, or Year
-
Quarter to Date
-
This Month, Quarter, or Year
-
Today
-
Year to Date
-
Yesterday
By default, when Filter by Rule is enabled on a numeric field, it is set to "None".
Numeric fields (such as integers, decimals, and currencies) support the following rules:
-
Above Average
-
Above Equals Value
-
Above Value
-
Below Average
-
Below Equals Value
-
Below Value
-
Bottom Items
-
Bottom Percent
-
Top Items
-
Top Percent
By default, when Filter by Rule is enabled on a numeric field, it is set to "None".
Text columns support the following type of rules:
-
Contains
-
Ends With
-
Is Equal
-
Not Contains
-
Not Equals
-
Starts With
To see these steps in action, check out this video below:
.png?width=1286&height=255&name=logo-raspberry%20(1).png)