How to create a report that answers the question: How many clients received a service during each quarter (or month)?
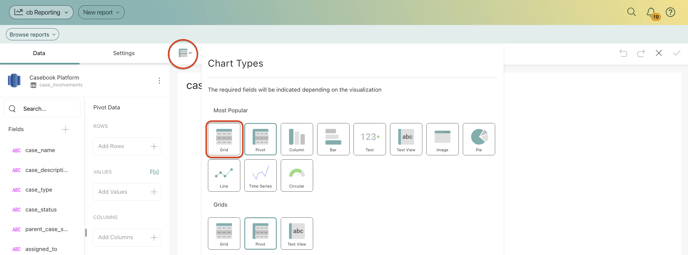
- Create a New Visualization
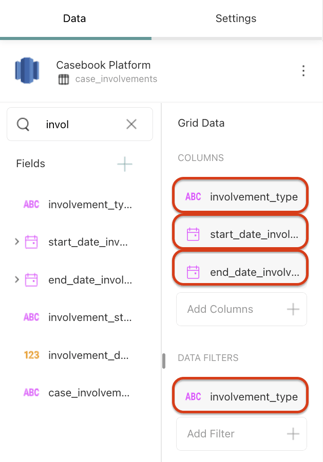
- Select the Case_Involvements Dataset
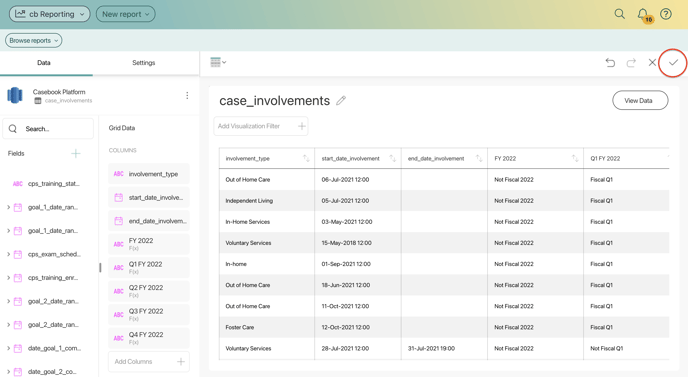
- Change the Chart Type to Grid
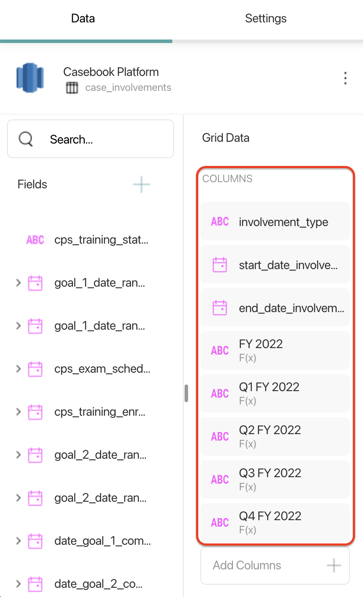
- Drag and drop the following fields into the Grid Data section under Columns
- Involvement type
- Involvement Start Date
- Involvement End Date
- Add a Filter for Involvement_Type and select the involvements that you wish to track in this report
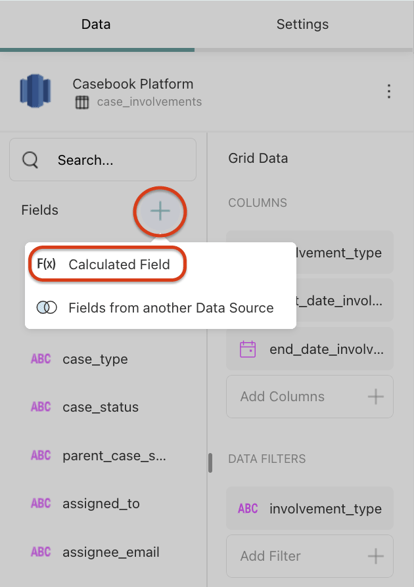
- Add a new Calculated Field by selecting the + Icon in the Fields List, then selecting Calculated Field
- Name the Field, then add the following formulas: Please note that you will have to repeat this process for each formula
- FY 2022
- if(and([start_date_involvement]> date(2021,12,31), [start_date_involvement] < date(2023,1,1)),"Fiscal 2022",if(isempty([end_date_involvement]), if(and([end_date_involvement] < date(2023,1,1), today()> date(2021,12,31)), "Fiscal 2022", "Not Fiscal 2022"),if(and([start_date_involvement] < date(2023,1,1), [end_date_involvement]> date(2021,12,31)), "Fiscal 2022", "Not Fiscal 2022")))
- Q1 FY22
- if(isempty([end_date_involvement]),if(and([start_date_involvement] < date(2022,4,1),(today() > date(2021,12,31))),"Fiscal Q1","Not Fiscal Q1"),if(and([start_date_involvement] < date(2022,4,1),([end_date_involvement] > date(2021,12,31))),"Fiscal Q1","Not Fiscal Q1"))
- Q2 FY22
- if(isempty([end_date_involvement]),if(and([start_date_involvement] < date(2022,7,1),(today() > date(2022,3,31))),"Fiscal Q2","Not Fiscal Q2"),if(and([start_date_involvement] < date(2022,7,1),([end_date_involvement] > date(2022,3,31))),"Fiscal Q2","Not Fiscal Q2"))
- Q3 FY22
- if(isempty([end_date_involvement]),if(and([start_date_involvement] < date(2022,10,1),(today() > date(2022,6,30))),"Fiscal Q3","Not Fiscal Q3"),if(and([start_date_involvement] < date(2022,10,1),([end_date_involvement] > date(2022,6,30))),"Fiscal Q3","Not Fiscal Q3"))
- Q4 FY22
- if(isempty([service_end_date]),if(and([service_start_date] < date(2023,1,1),(today() > date(2022,9,30))),"Fiscal Q4","Not Fiscal Q4"),if(and([service_start_date] < date(2023,1,1),([service_end_date] > date(2022,9,30))),"Fiscal Q4","Not Fiscal Q4"))
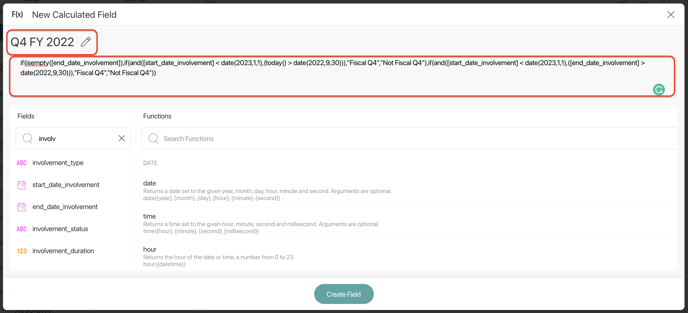
- if(isempty([service_end_date]),if(and([service_start_date] < date(2023,1,1),(today() > date(2022,9,30))),"Fiscal Q4","Not Fiscal Q4"),if(and([service_start_date] < date(2023,1,1),([service_end_date] > date(2022,9,30))),"Fiscal Q4","Not Fiscal Q4"))
- FY 2022
- Drag these new fields into the Grid Data section under Columns
- Save the report by selecting the checkmark icon in the upper right-hand corner
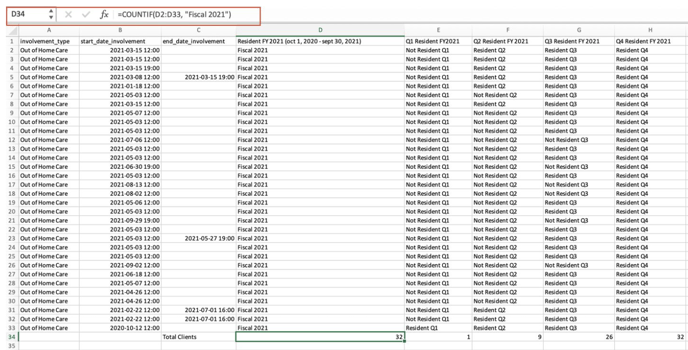
- If you would like to sum the rows, you will need to export this report to Exccel
- At the bottom of the last row under the columns D-H use the formula below
to sum the number of residents per time range.- For Column D: =COUNTIF(range, "Fiscal 2022")
- For Column E: =COUNTIF(range, "Fiscal Q1")
- For Column F: =COUNTIF(range, "Fiscal Q2")
- For Column G: =COUNTIF(range, "Fiscal Q3")
- For Column H: =COUNTIF(range, "Fiscal Q4")
- At the bottom of the last row under the columns D-H use the formula below
- For Column E: =COUNTIF(range, "Fiscal Q1")