How to Add a Visualization Filter
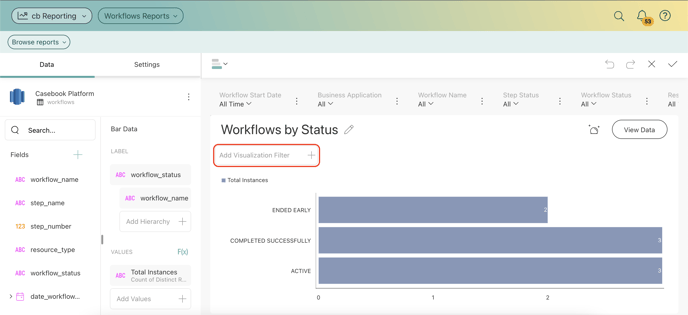
- From the Report Builder, select Add Visualization Filter.
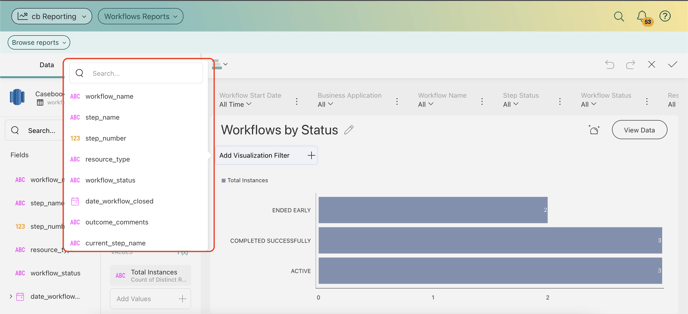
- The filter options displayed in the Visualization Filters area depend on the data type of the field.
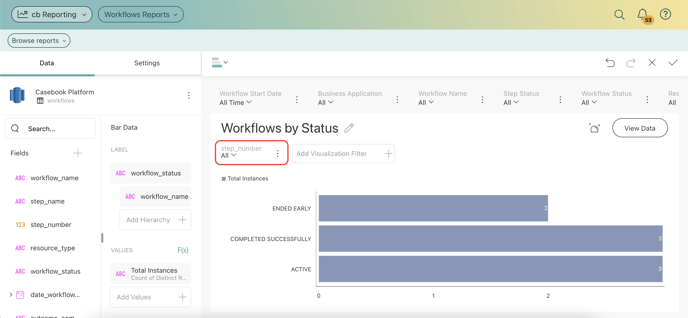
- Once created, the filter will be displayed on top of your visualization in the Visualizations Editor.
To see these steps in action, check out this video below: