Our VOCA Reporting feature is designed to provide critical insights, but it requires specific configurations to ensure accurate functionality. To get started, please refer to this guide on setting up VOCA reporting in Casebook.
If you’d like to take full advantage of this feature without the setup hassle, our team can build the report for you! Contact your Customer Success Manager to learn more about how we can streamline this process and make VOCA reporting work for you.
You will need to begin by creating a new Custom Report in cb Reporting. We suggest you name this new dashboard, VOCA PMT Report.
Create Dashboard Filters
- Begin by creating two dashboard filters.
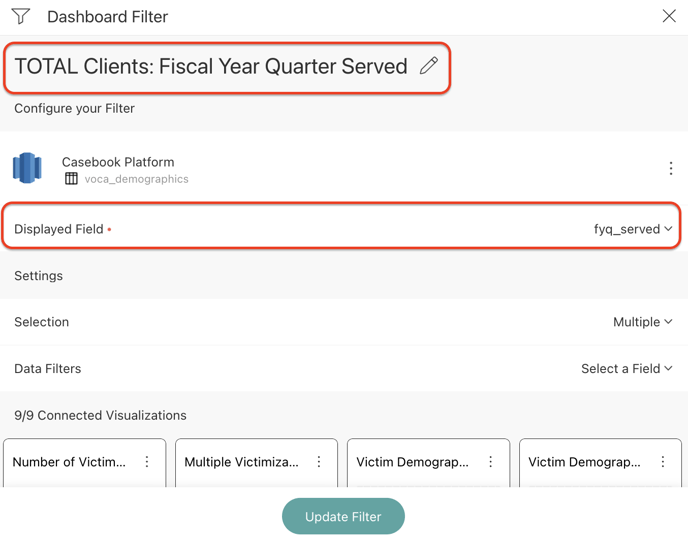
- TOTAL Clients: Fiscal Year Quarter Served
- Select the voca_demographics dataset from the views tab.
- Change the name of your filter, and select fyq_served as the Displayed Field.
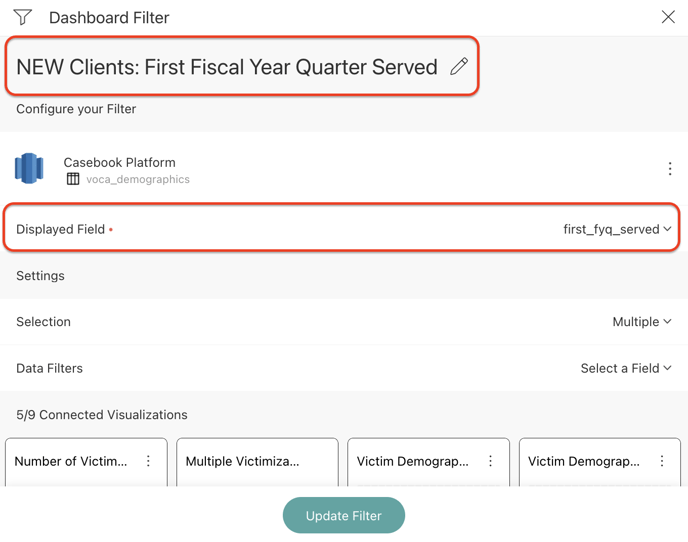
- NEW Clients: First Fiscal Year Quarter Served
- Select the voca_demographics dataset from the views tab.
- Change the name of your filter, and select first_fyq_served as the Displayed Field.
- TOTAL Clients: Fiscal Year Quarter Served
Filter Guide
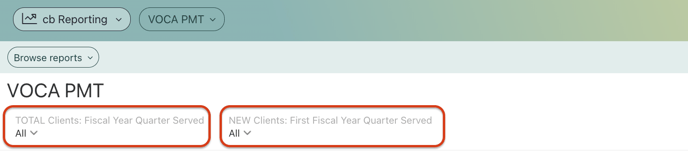
- To filter by TOTAL number of clients in the Reporting Period (New + Continuing Clients), use the TOTAL Clients: Fiscal Year Quarter Served filter.
- To filter by NEW number of clients in the Reporting Period (first service this fiscal year), use the NEW Clients: First Fiscal Year Quarter Served filter. (Note: this filter only applies to relevant charts indicated by the OVC.)
- If no filter is selected, you will see clients served for all time.
- Please only use one filter at a time.
Number of Victims Served During the Reporting Period
This report will change based on the dashboard filter selected. This will show you the number of victims that you served within the reporting period selected (filters).
To create this report, follow the steps below:
- On your VOCA dashboard, create a new visualization. Select the voca_demographics dataset from the views tab.
- Change the chart type to Text.
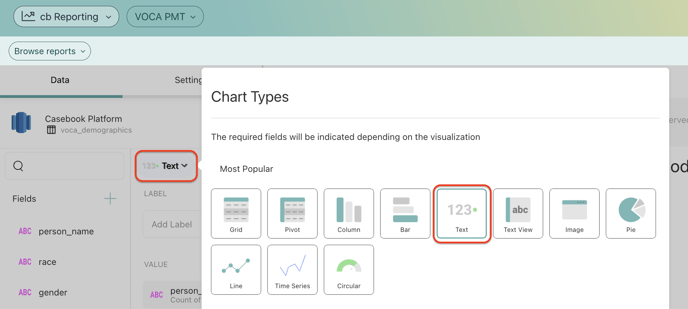
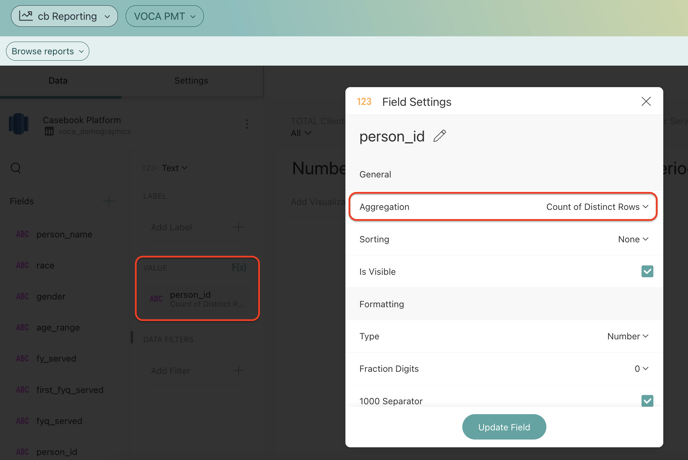
- Add person_id to the Values section, and change the aggregation to Count of Distinct Rows.
- Save your report!
Multiple Victimizations (TOTAL Clients)
This report should be filtered to TOTAL CLIENTS as defined by VOCA reporting requirements. This will show you the number of victims that you served within the reporting period that presented with more than one victimization type.
To create this report, follow the steps below:
- On your VOCA dashboard, create a new visualization. Select the voca_victimization dataset from the views tab.
- Change the chart type to Text.
- Add person_id to the Values section, and change the aggregation to Count of Distinct Rows.
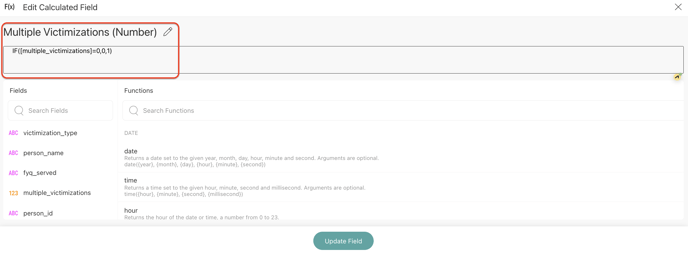
- Create a Calculated Field for Multiple Victimizations (Number)
- IF([multiple_victimizations]=0,0,1)
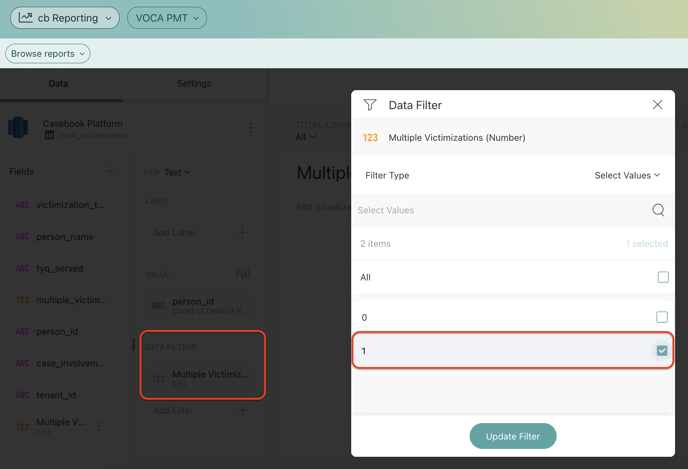
- Add your new calculated field, Multiple Victimizations (Number) to the Data Filter section and filter by the value 1.
- Save your report!
Victim Demographics - Race/Ethnicity (Filter to NEW Clients)
This report should be filtered to NEW CLIENTS as defined by VOCA reporting requirements. This will show you the count by race/ethnicity of the number of new clients you served within the reporting period.
To create this report, follow the steps below:
- On your VOCA dashboard, create a new visualization. Select the voca_demographics dataset from the views tab.
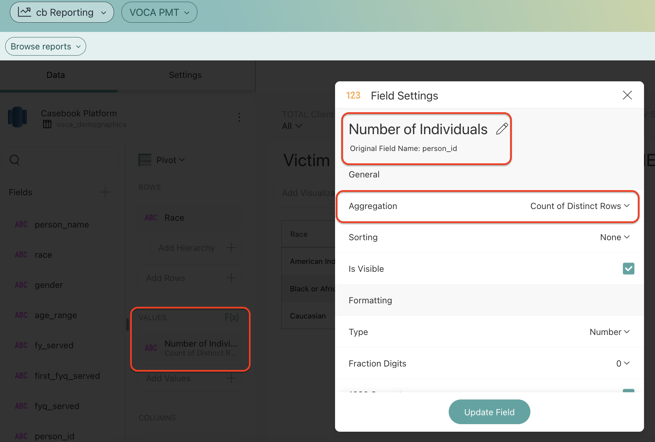
- Add person_id to the Values section, and change the aggregation to Count of Distinct Rows. Change the name of the field to Number of Individuals.
- Create a Calculated Field for Race.
- IF(isempty([race]),"Not Reported",[race])
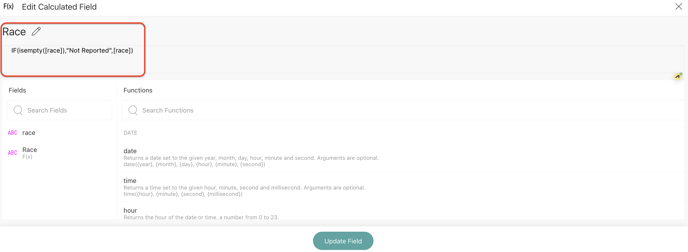
- Add your new calculated field, Race to the Rows section.
- Save your report!
Victim Demographics - Gender (Filter to NEW Clients)
This report should be filtered to NEW CLIENTS as defined by VOCA reporting requirements. This will show you the count by gender of the number of new clients you served within the reporting period.
To create this report, follow the steps below:
- On your VOCA dashboard, create a new visualization. Select the voca_demographics dataset from the views tab.
- Add person_id to the Values section, and change the aggregation to Count of Distinct Rows. Change the name of the field to Number of Individuals.
- Create a Calculated Field for Gender.
- IF(isempty([gender]),"Not Reported",[gender])
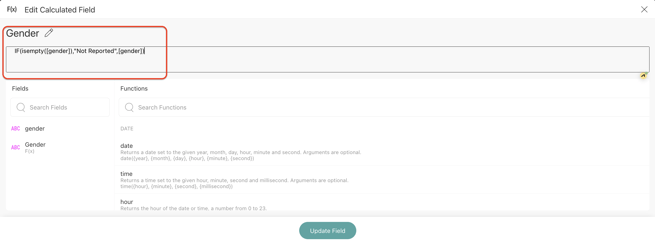
- Add your new calculated field, Gender to the Rows section.
- Save your report!
Victim Demographics - Age (Filter to NEW Clients)
This report should be filtered to NEW CLIENTS as defined by VOCA reporting requirements. This will show you the count by age range of the number of new clients you served within the reporting period.
To create this report, follow the steps below:
- On your VOCA dashboard, create a new visualization. Select the voca_demographics dataset from the views tab.
- Add person_id to the Values section, and change the aggregation to Count of Distinct Rows. Change the name of the field to Number of Individuals.
- Create a Calculated Field for Age Range.
- IF(isempty([age_range]),"Not Reported", [age_range])
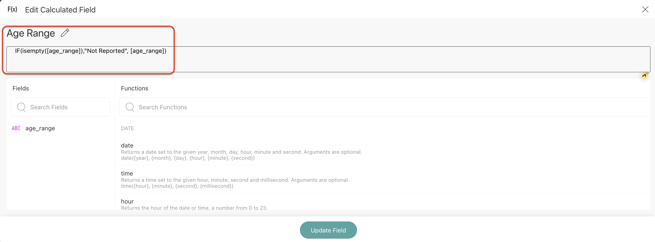
- Add your new calculated field, Age Range to the Rows section.
- Save your report!
Total Numbers by Service Category (Filter to TOTAL Clients)
This report should be filtered to TOTAL CLIENTS as defined by VOCA reporting requirements. This will show you the count by VOCA Service of the number of clients you served within the reporting period.
To create this report, follow the steps below:
- On your VOCA dashboard, create a new visualization. Select the voca_services dataset from the views tab.
- Add person_id to the Values section, and change the aggregation to Count of Distinct Rows. Change the name of the field to Number of Individuals.
- Add the field voca_service to the Rows section.
- Save your report!
Victimization Type (Filter to TOTAL Clients)
This report should be filtered to TOTAL CLIENTS, as defined by VOCA reporting requirements. This will show you the count by victimization type of the number of clients you served within the reporting period.
To create this report, follow the steps below:
- On your VOCA dashboard, create a new visualization. Select the voca_victimization dataset from the views tab.
- Add person_id to the Values section. Change the name of the field to Number of Individuals.
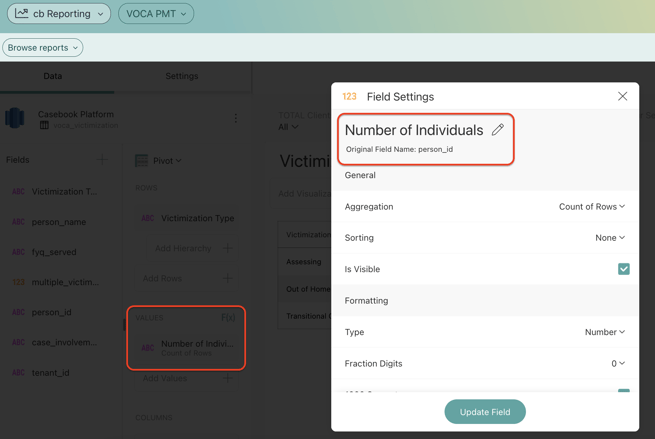
- Add the field victimization_type to the Rows section.
- Save your report!
Number of Times Each Service (Subcategory) Was Provided (Filter to TOTAL Clients)
This report should be filtered to TOTAL CLIENTS as defined by VOCA reporting requirements. This will show you the count by VOCA Service Subcategory of the number of clients you served within the reporting period.
To create this report, follow the steps below:
- On your VOCA dashboard, create a new visualization. Select the voca_services dataset from the views tab.
- Add person_id to the Values section, and change the aggregation to Count of Distinct Rows. Change the name of the field to Number of Individuals.
- Add the field voca_service_subcategory to the Rows section.
- Save your report!
Special Classifications of Individuals (Filtered to TOTAL Clients)
This report should be filtered to TOTAL CLIENTS as defined by VOCA reporting requirements. This will show you the count by special classification of the number of clients you served within the reporting period. This report can be filtered by NEW and/or TOTAL clients.
To create this report, follow the steps below:
- On your VOCA dashboard, create a new visualization. Select the voca_demographics dataset from the views tab.
- Create a Calculated Field for Total People Served {"Total People Served"} and add it to the Rows section.
-1.png?width=655&height=336&name=image%20(9)-1.png)
- Create a Calculated Field for LGBTQ+.
- IF([lgbtq_]="yes",[person_id],empty())

- Add your new calculated field, LGBTQ+ to the Values section. Change the aggregation to Count of Distinct Rows.
- Create a Calculated Field for Deaf/Hard of Hearing.
- IF([deaf_hard_of_hearing]="yes",[person_id],empty())
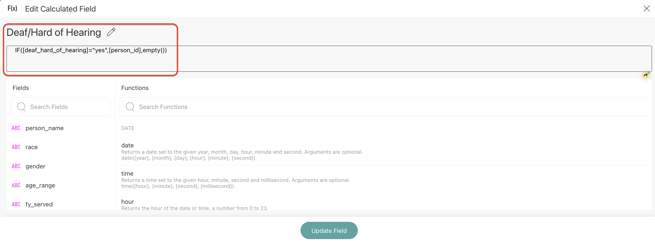
- Add your new calculated field, Deaf/Hard of Hearing to the Values section. Change the aggregation to Count of Distinct Rows.
- Create a Calculated Field for Homeless_2.
- IF([homeless]="yes",[person_id],empty())
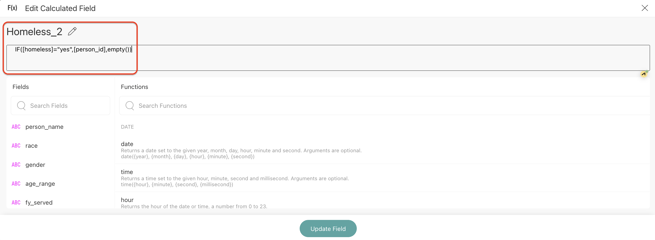
- Add your new calculated field, Homeless_2 to the Values section. Change the aggregation to Count of Distinct Rows.
- Create a Calculated Field for Immigrants/Refugees/Asylum Seekers.
- IF([immigrants_refugees_asylum_seekers]="yes",[person_id],empty())
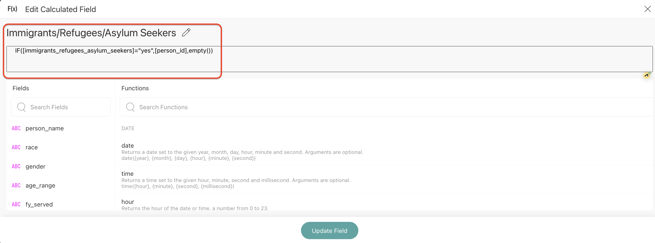
- Add your new calculated field, Immigrants/Refugees/Asylum Seekers to the Values section. Change the aggregation to Count of Distinct Rows.
- Create a Calculated Field for Veterans.
- IF([veteran]="yes",[person_id],empty())
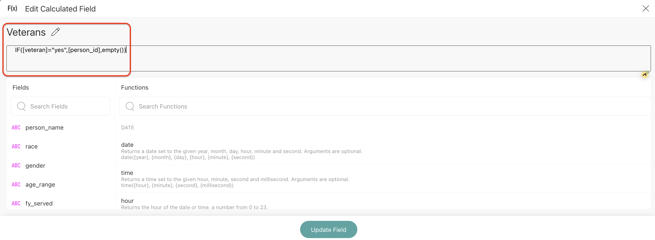
- Add your new calculated field, Veterans to the Values section. Change the aggregation to Count of Distinct Rows.
- Create a Calculated Field for Victims with Disabilities: Cognitive/ Physical /Mental.
- IF([victims_with_disabilities_cognitive_physical_mental]="yes",[person_id],empty())
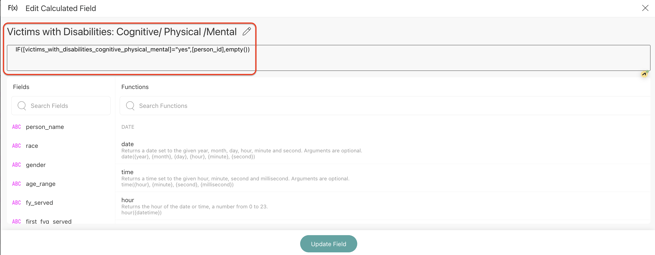
- Add your new calculated field, Victims with Disabilities: Cognitive/ Physical /Mental to the Values section. Change the aggregation to Count of Distinct Rows.
- Create a Calculated Field for Victims with Limited English Proficiency.
- IF([limited_english_proficiency]="yes",[person_id],empty())
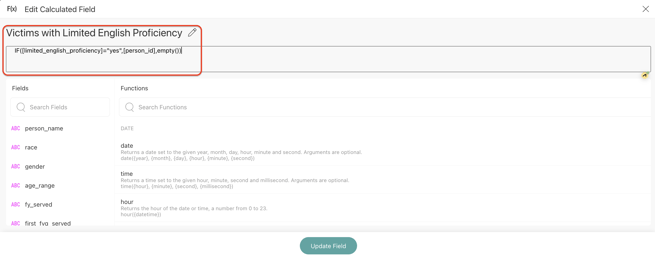
- Add your new calculated field, Victims with Limited English Proficiency to the Values section. Change the aggregation to Count of Distinct Rows.
- Save your report!
Connect Your Dashboard Filters
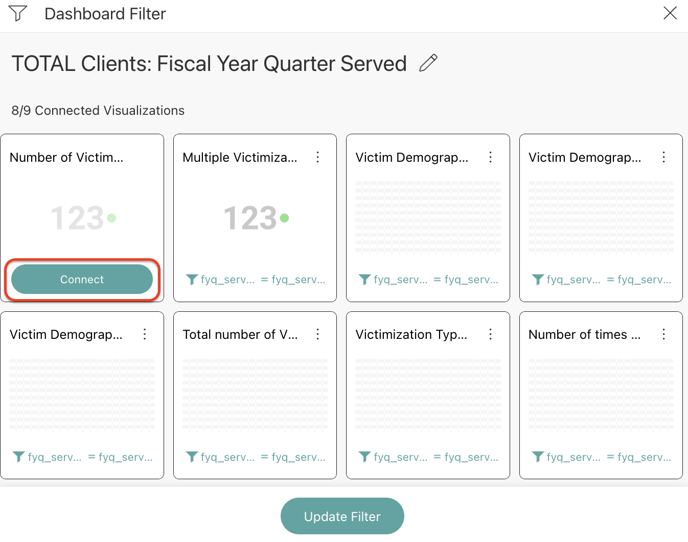
- TOTAL Clients: Fiscal Year Quarter Served
- Connect this filter to all of your visualizations by using the fyq_served=fyq_served.
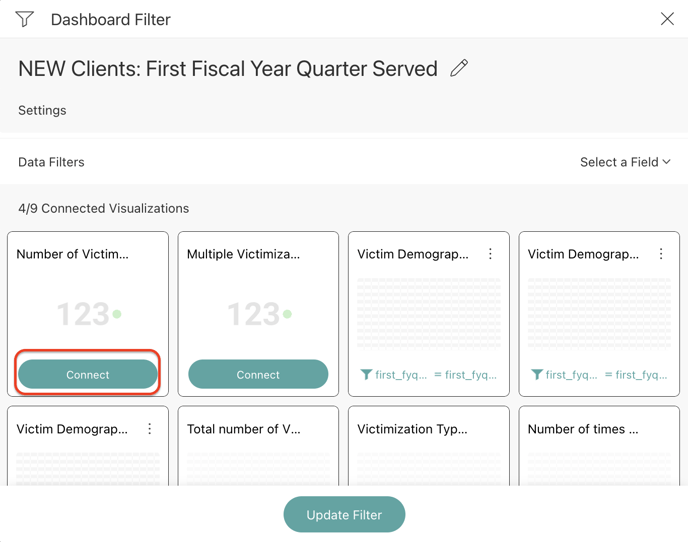
- NEW Clients: First Fiscal Year Quarter Served
- Connect this filter to the visualizations: Numbers of Victims Served in the Reporting Period, Victim Demographics Age, Victim Demographics Gender, Victim Demographics Race/Ethnicity, and Special Classifications by using first_fyq_served = first_fyq_served.
- Connect this filter to the visualizations: Numbers of Victims Served in the Reporting Period, Victim Demographics Age, Victim Demographics Gender, Victim Demographics Race/Ethnicity, and Special Classifications by using first_fyq_served = first_fyq_served.
- Connect this filter to all of your visualizations by using the fyq_served=fyq_served.